
The Winners and Losers of Distributed Work (Part 1)
How will AI and remote work affect global and local income distributions? Lessons from the globalization and automation of manufacturing jobs.


Who benefits from distributed work? How will the reshuffling of office work affect inequality and income distribution within and between countries? The answers to these questions have profound political, financial, and practical implications. The history of globalization offers important insights into who wins and who loses when jobs are untethered from their original location, and the production process becomes less centralized.
"Globalization" describes the increasing interconnectedness of nations through trade, investment, technology, and culture. This process has roots that stretch back centuries, but its most transformative phases began in the late 19th and early 20th centuries. The advent of steamships, railways, and the telegraph during the Industrial Revolution facilitated faster movement of goods and communication. This era, sometimes termed the "first wave of globalization," witnessed an unprecedented surge in international trade and capital flows, with empires like Britain at the forefront.
However, the two World Wars and the Great Depression between the 1910s and 1940s disrupted this wave, leading to a retreat from global economic integration. Nations erected trade barriers, and protectionist policies took precedence. It was only after World War II that the world saw a concerted effort to rebuild international cooperation and economic integration. Institutions like the United Nations, the International Monetary Fund, and the World Bank were established, aiming to prevent conflicts and stabilize the global economy.
The latter half of the 20th Century, particularly from the 1970s onward, marked the onset of what many term the "second wave of globalization." This period was characterized by significant advances in technology, notably in transportation and communication. Container ships, the rise of the internet, and the proliferation of information technologies made global trade more efficient and interconnected. Additionally, political changes, such as the opening up of China's economy under Deng Xiaoping and the dissolution of the Soviet Union, brought many nations into the global economic fold. Free trade agreements proliferated, and multinational corporations expanded their reach across continents.
By the end of the 20th Century, globalization was the dominant force shaping economies, politics, and cultures worldwide. Emerging economies, especially in Asia, witnessed rapid industrialization and growth. However, the period leading up to 2008 was also marked by increasing concerns about the uneven benefits of globalization, with debates on income inequality, cultural homogenization, and environmental degradation taking center stage. These concerns were further exacerbated by the Global Financial Crisis (GFC), which posed significant challenges to the global economic order and sparked a reevaluation of the merits and pitfalls of unfettered globalization.

In 2008, as the GFC shook up the global economy, more than 60% of the global GDP consisted of international trade, mostly trade in physical goods such as automobiles, apparel, and electronic devices. After 2008, the share of global trade in goods has been declining and has yet to regain its pre-GFC peak. The crisis represented the end point of the era of "high globalization" that began with the collapse of the USSR in the late 1980s.
While high globalization ended in 2008, its impact on employment and income distribution loomed large in the political battles of the 2010s (Brexit, Trump) and the geopolitical tensions of the 2020s (Russia, China, and beyond). So, who benefitted from the era of high globalization, and what can that tell us about the potential impact of the redistribution of office-based work?
The Elephant in the Room
By 2016, the popular sentiment in many developed countries was that globalization benefitted large corporations and "billionaires" but undermined many middle-class working people.
In 2016, Christoph Lakner and Branko Milanovic set out to quantify the winners and losers of high globalization. To do so, they compiled and cleaned up household income data from across the world, spanning the years 1988 to 2008. They then compared changes in income households across countries, treating the whole world as one single market. In other words, instead of comparing countries, they provided a direct comparison of groups of people within countries. More specifically, they set out to measure how the incomes of individuals across different percentiles of the global income distribution changed over time.
What did they find?
Lakner and Milanovic's analysis revealed that the emerging middle classes in developing economies, particularly in Asia, experienced a significant uplift in their incomes. This surge was attributed to rapid industrialization and greater integration into the global economy, leading to a remarkable transition of millions out of poverty, mostly in China.
Meanwhile, The middle class in many developed countries, typically residing in the 75th to 85th percentiles of the global income distribution, saw stagnation or even a decline in their income growth. This suggested that these groups, despite living in some of the world's most prosperous nations, did not partake as richly in the benefits of globalization.
At the very pinnacle, the global top 1% witnessed a dramatic spike in their incomes, underscoring the era's trend of increasing wealth concentration. In essence, while globalization brought prosperity to many, especially in emerging markets, it also accentuated disparities, both within and between countries. In addition, the world's poorest, though witnessing some income growth, did not experience gains as substantial as other groups and remained at the lower rungs of the global income ladder.
To illustrate their findings, Lakner and Milanovic plotted income growth against the global income distribution. The result was a curve that visually represented the relative winners and losers of globalization. The shape of the chart, which resembled an elephant with a raised trunk, made it easier to identify and discuss specific trends.
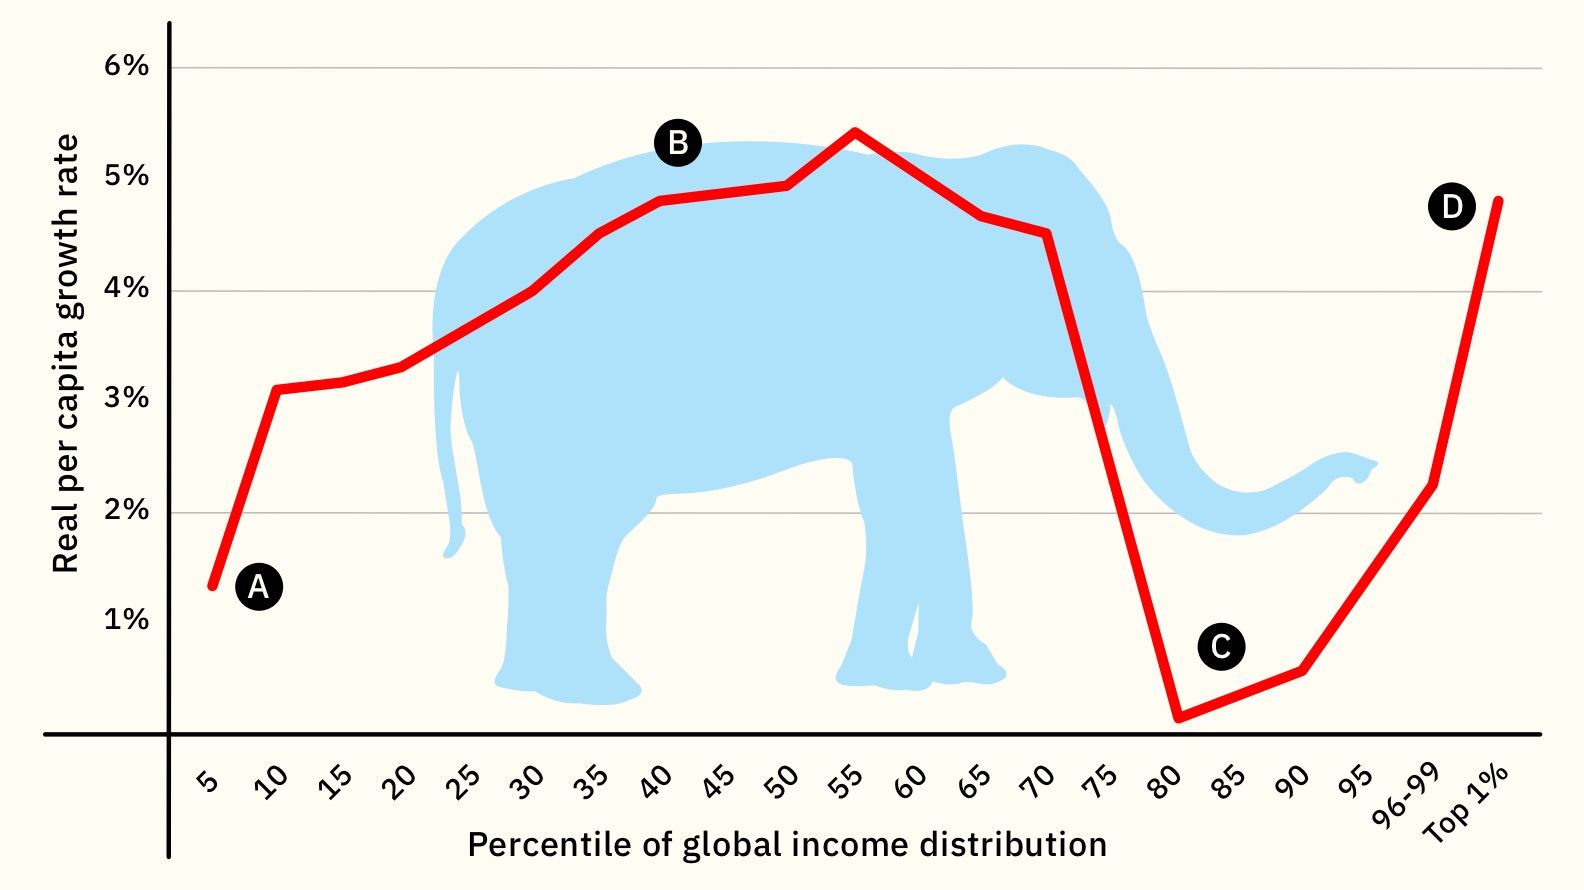
As you can see above, part A (The Tail), starting portion of the chart, represents the world's poorest individuals. It generally shows some upward movement, indicating modest income growth for this segment. Part B (The Body), resembling the back of the elephant, represents the middle class in developing countries which saw significant economic benefits during the period. Part C (The Dip) indicates a stagnation or even decline in income growth and largely represents the middle class in developed countries. And part D (The Raised Trunk) highlights the substantial gains of those in the top 1% of the global income distribution — those in and above the upper-middle class of developed nations. Note that the chart only captures changes in income rather than wealth. As such, it might underplay the gains from ownership of shares, real estate, and other assets.
The elephant chart has become one of the most recognized visuals describing the effects of globalization. What can it tell us about the future? Before we get to that, we must first understand the forces that shaped the original elephant.
Carving up the Elephant
The elephant chart describes the fortunes of four main groups. To paraphrase Tolstoy, we can say that two groups that benefitted from globalization benefitted for similar reasons. The emerging middle class in the developing world had access to better jobs and the skills to perform these jobs, and the upper middle class and top percentiles of earners in developed countries worked for — and owned shares in — the large multinational corporations that benefitted from cheap labor and the opening up of new consumer and financial markets.
Meanwhile, the two global groups that fell behind stagnated in their own unique ways. Let's start with the world's poorest, at the elephant's tail. People at the bottom percentiles of the global income distribution barely benefitted from globalization for several reasons. They lived too far from the regions in which new factories were being built and were unable to migrate due to financial, political, or personal constraints. Some lacked the skills (and stamina) required for entry-level manufacturing jobs. Some of them worked in traditional industries, particularly agriculture, that did not benefit from globalization to the same extent that manufacturing did.
In some cases, globalization-driven growth in manufacturing had a direct negative effect on traditional industries, as factories and roads were built on agricultural land, and natural irrigation sources were polluted. Meanwhile, many or all developing countries lacked the institutions to mitigate such effects, particularly when the affected parties were the poorest citizens who lived away from the centers of power.
The above is not meant as an argument against globalization. Given enough time, even those in the bottom percentiles could perhaps enjoy faster income growth (indeed, data suggests that this happened after 2008). For our purposes, what matters is that some people lack the skills, access, or permission to benefit from the massive opportunities presented by the explosion in global trade.
We now skip to the other group that saw its income stagnate, represented by the dip in the elephant's trunk. Those with incomes between the 80th and 95th global percentile are members of the lower-middle and middle class in developed countries. These include blue-collar workers without a college degree, but also college-educated white-collar workers in some professions and industries.
The era of high globalization has not been kind to these groups for several reasons. Manufacturing jobs "moved" to countries with lower labor costs, leaving many unemployed or employed in jobs that did not offer the same benefits and stability. Those that remained employed often faced more competition — as did their employers — resulting in downward pressure on salaries and working conditions.
Pressure from global competition also spurred the development and spread of a variety of automation measures, leading to additional job losses. The decimation of manufacturing jobs was bad enough in itself. It also had knock-on effects on the communities in which such workers lived, leading to the deterioration of local schools, healthcare facilities, and social cohesion. And here, too, local institutions failed to mitigate the negative effects of globalization.
What does all this tell us about the future? We're almost ready to tackle this question. But first, I would like to highlight another divergence in fortunes that is not captured by the elephant chart.
The Tip of the Trunk
We've seen above that the top 1% of global income earners enjoyed rapid income growth in the era of high globalization. Public resentment of this fact is reflected in the slogan "We are the 99%," which became popular during the Occupy Wall Street protests in 2011. The slogan was used elsewhere in the world to highlight the struggle of regular people in a world that seemed designed to serve the interests of the top 1%.
But beyond the popular imagination, a whole new struggle is taking place — the struggle within the 1%. In 1994, the economist Paul Krugman noticed that the U.S. income inequality expanded "not just within groups, but also between groups." Looking at the economy as a whole, he saw the growing gap between the top percentile (1%) of earners and the middle one (50%). But looking inside the top percentile, he also noticed a growing gap between the very top (0.1%) and the middle (0.5%).
In other words, the pattern of inequality within the top 1% was quite similar to the pattern observed in the overall economy. The rich got richer faster than everyone else, and the very rich got richer faster than the rich. Krugman dubbed this phenomenon "fractal inequality," alluding to a situation when zooming in on any individual part revealed a shape that resembled the overall organism — just like in a Barnsley fern.
The chart below provides a breakdown of income growth within the top 1% of U.S. income earners from 1950 to 2008. It divides the 1% into four groups. As you can see, the income of those in the top 0.01% (the top 1% of the top 1%) increased much more dramatically than the income of those who are merely in the middle of the top 1%, particularly from the late 1980s onwards.

As the table below shows, during the era of high globalization, between 1988 to 2008, the income of the top 0.01% grew by more than 200%, while the income of other members of the 1% grew by "only" 137%. The growing gap is much starker in absolute terms. Over a period of thirty years, those at the bottom of the 1% added $132,302 to their average annual income, while those at the top added more than $15 million.
| Group | Top 0.01% | 0.01%–0.1% | 0.1%–0.5% | 0.5%–1% |
|---|---|---|---|---|
| Percentage Change | 201% | 156% | 140% | 137% |
| Total Change | $15,143,176 | $1,279,705 | $275,394 | $132,302 |
By 2008, the top 0.1% of earners captured more than 8% of all the income in the U.S., or about 80 times more than the average earner. We tend to think that the top 0.1% consists mostly of company founders, entertainment stars, and top athletes. But in reality, the majority of 0.1 percenters are corporate employees — executives, managers, supervisors, and financial professionals. Their compensation accounts for more than two-thirds of the shift in national income to the 0.1% during the era of high globalization. In plain English, the top 0.1% consists mostly of the salaried beneficiaries of globalization, and their rising incomes are the main driver of the growing gap between the top 0.1% and everyone else.
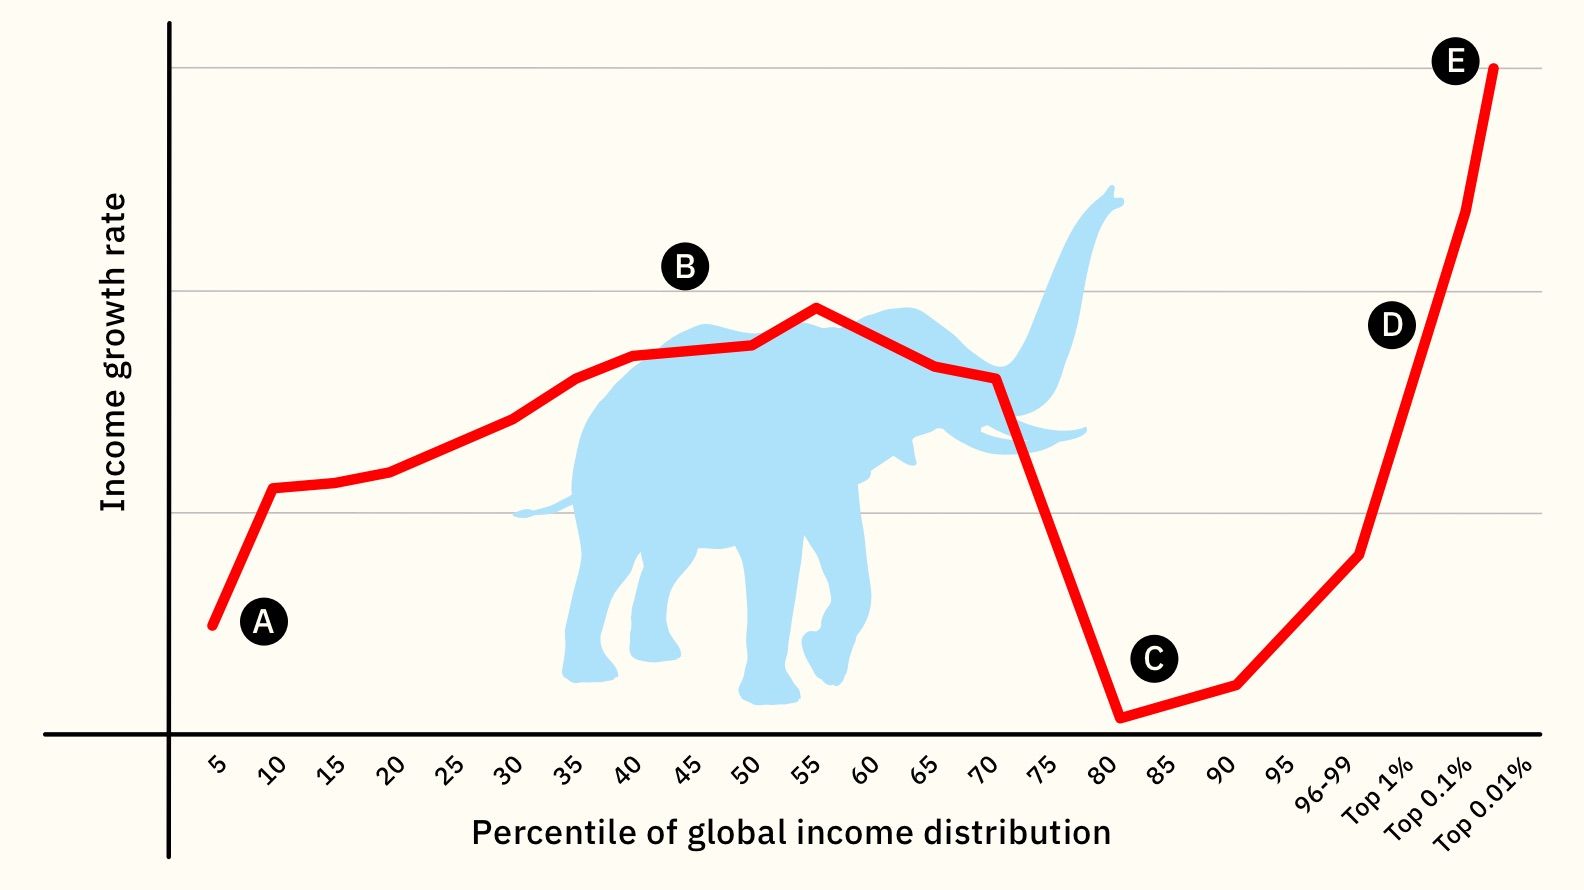
Going back to the elephant chart, the stylized version below offers a better picture of what actually happened during the era of booming international trade in goods. The emerging middle class benefitted, the existing middle class stagnated, the rich got richer, and the very rich got richer still.
While global trade in goods peaked in 2008, global trade in services continued to grow. As the economist Richard Baldwin points out, services are the future of globalization, particularly intermediate or B2B services. These services are provided by people who perform traditional office-based tasks: "bookkeepers, forensic accountants, CV screeners, administrative assistants, online client help staff, graphic designers, copyeditors, personal assistants, travel agents, I.T. security consultants, I.T. help staff, software engineers, lawyers who can check contracts, financial analysts who can write reports, and the list goes on and on."
How will this new era of globalized trade in services differ from the previous one of globalized trade in goods? Who will be the biggest winners and losers? And how will it affect offices and cities in the developed and developing world?
Join me next week as I continue to explore.
Best,


Old/New by Dror Poleg Newsletter
Join the newsletter to receive the latest updates in your inbox.


)