
Satellite data feature
How Cities Grow (or Don’t)
Twenty cities photographed from orbit in 1990 and today. Same patch of ground, same scale, both times.
Shenzhen
built up more than out
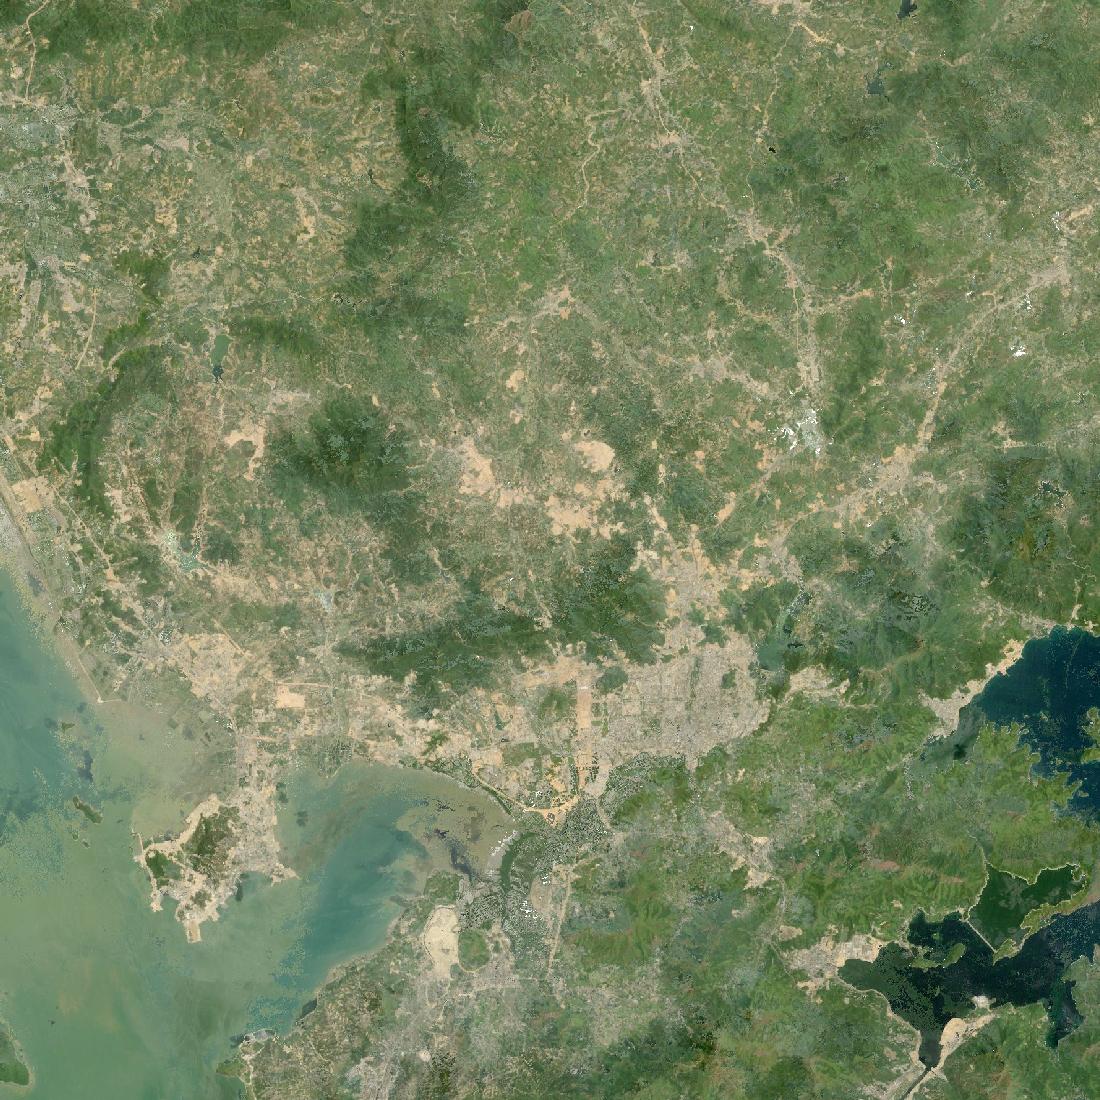 199050 km50 km
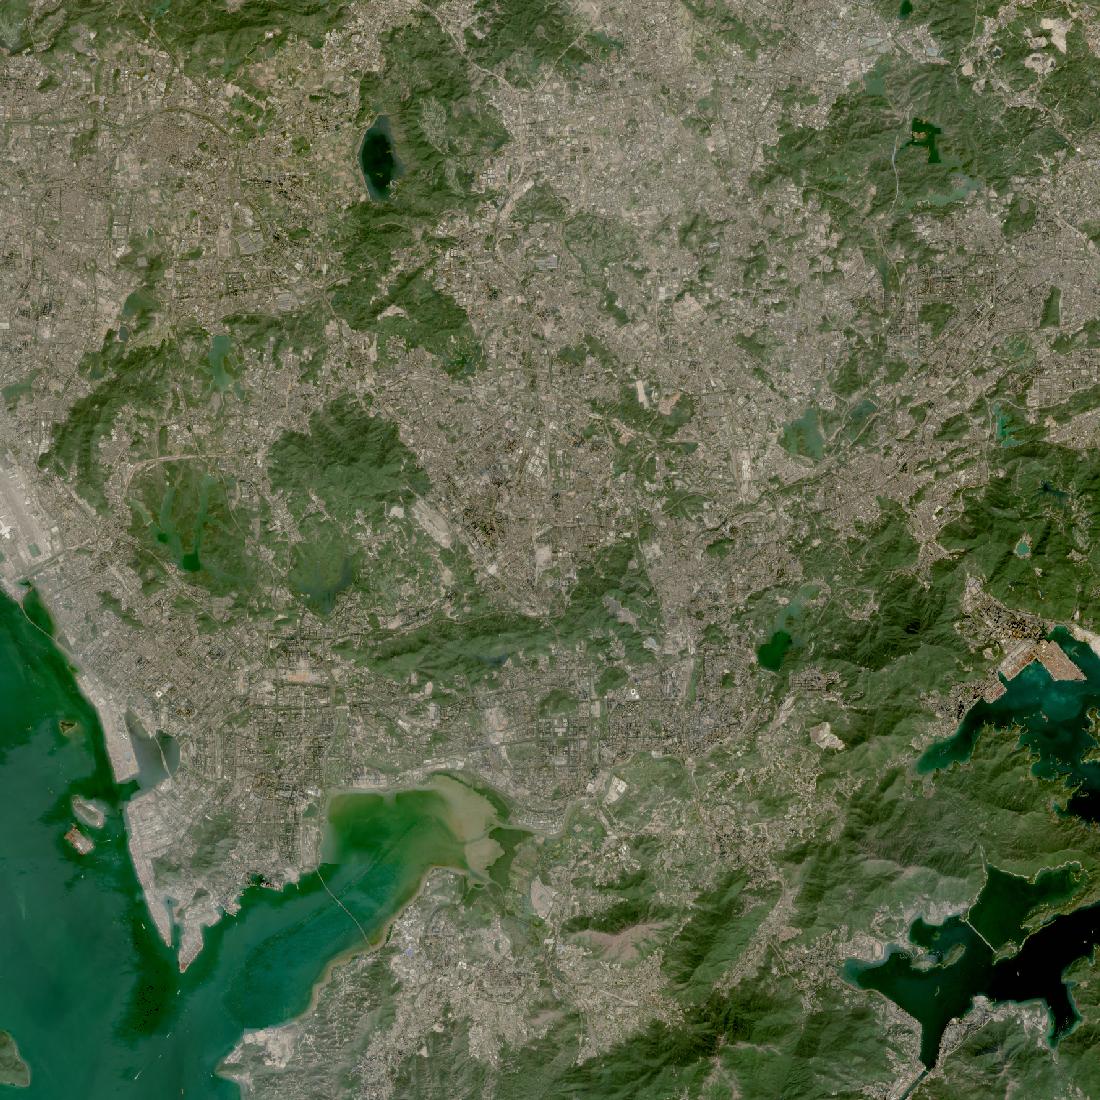 2026-01-1350 km50 km
- Built-up area
- 90 → 317 km²
- 3.5×
- People in frame
- 3.4M → 14.9M
- 4.4×
- People per km²
- 1,350 → 5,954
- Per square mile
- 3,497 → 15,424
A fishing and farming district beside Hong Kong in the older frame, designated a special economic zone in 1980. People arrived faster than ground was added, so it is denser now as well as larger.
San Francisco
barely changed
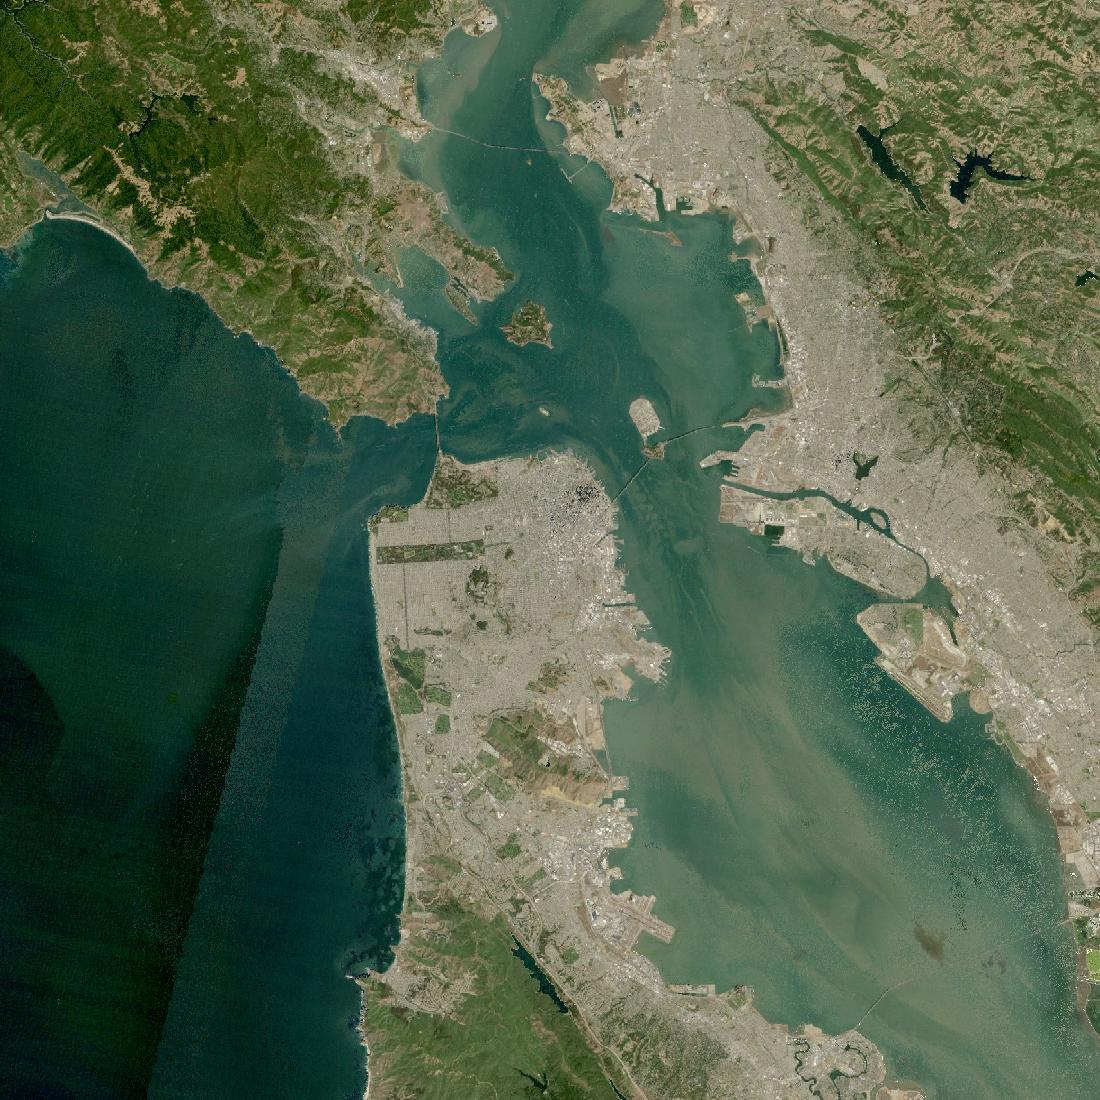 199050 km50 km
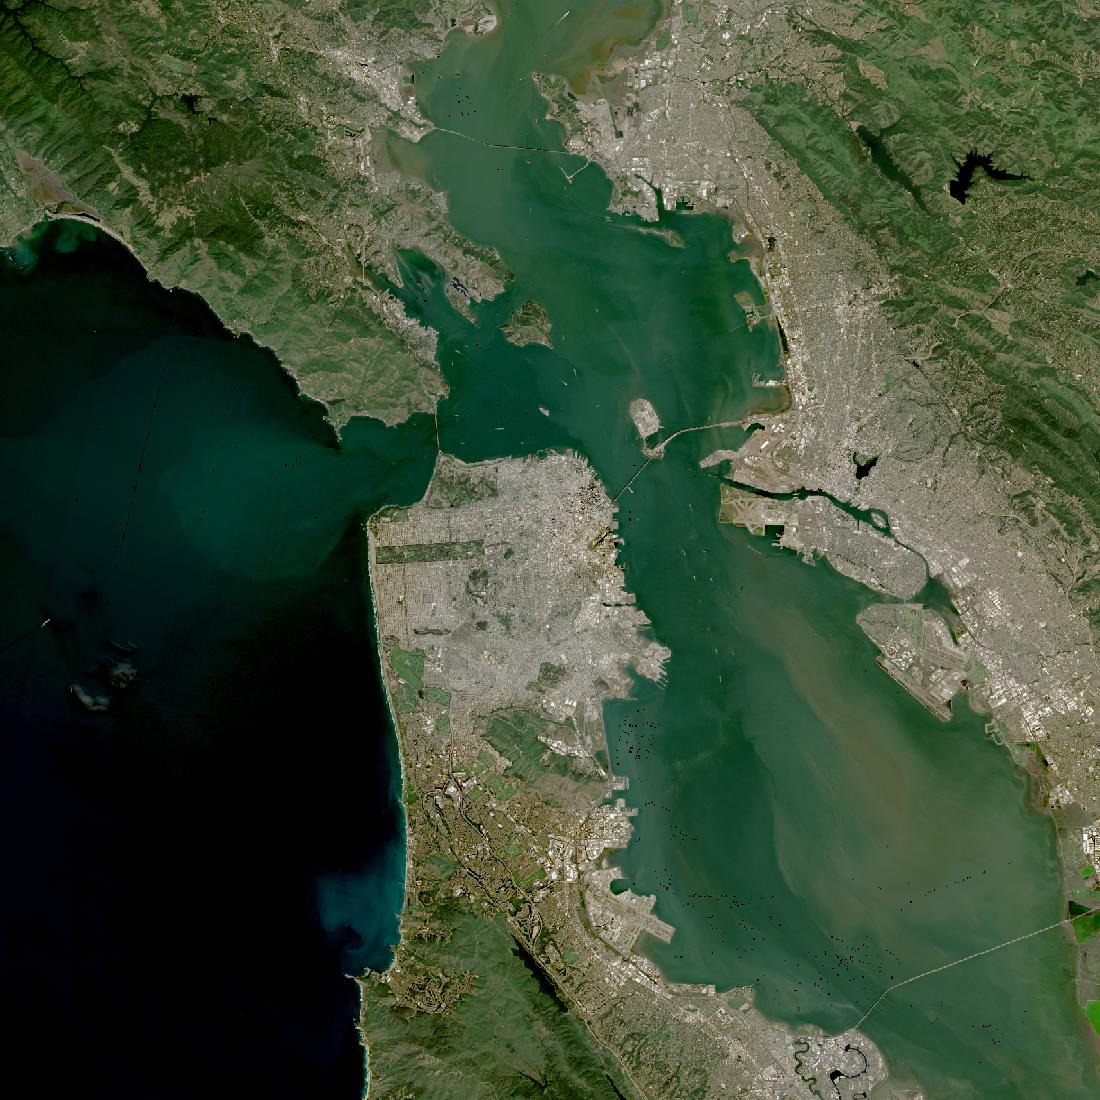 2026-04-0550 km50 km
- Built-up area
- 156 → 175 km²
- 1.1×
- People in frame
- 2.0M → 2.3M
- 1.1×
- People per km²
- 815 → 927
- Per square mile
- 2,113 → 2,401
Twenty square kilometres of new ground and 279,000 more people in thirty-five years. Water on three sides accounts for part of that. The rest is what was permitted.
Same thirty-five years, same fifty kilometres of ground. Shenzhen added 228 square kilometres of city and 11.5 million people; San Francisco added 20 and 279,000. Neither city is simply richer or younger than the other — they made different decisions about whether to build. Across twenty cities those decisions fall into four patterns, and a fifth that is really the absence of one.
Chengdu
absorbed its hinterland
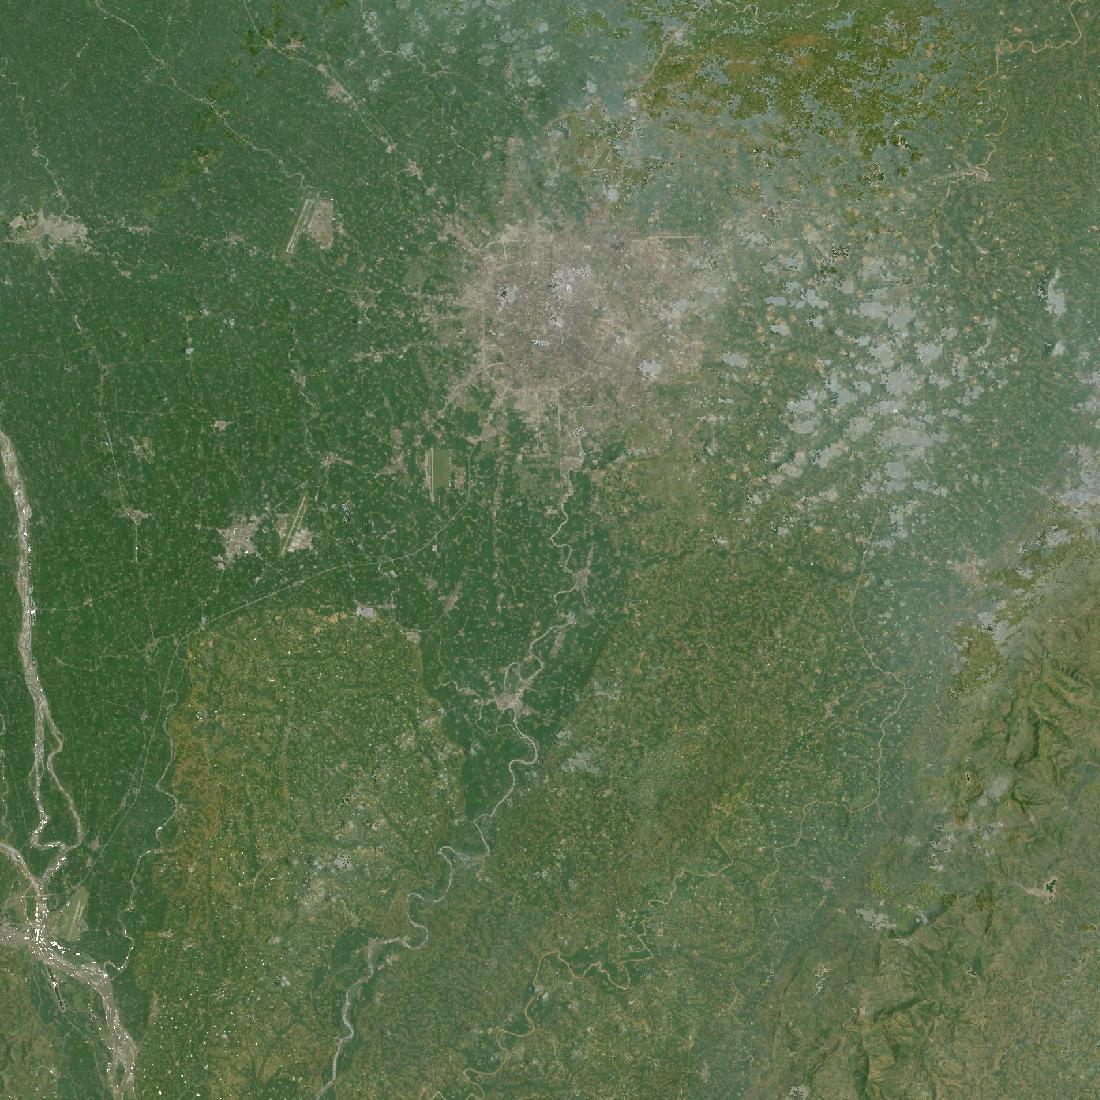 199050 km50 km
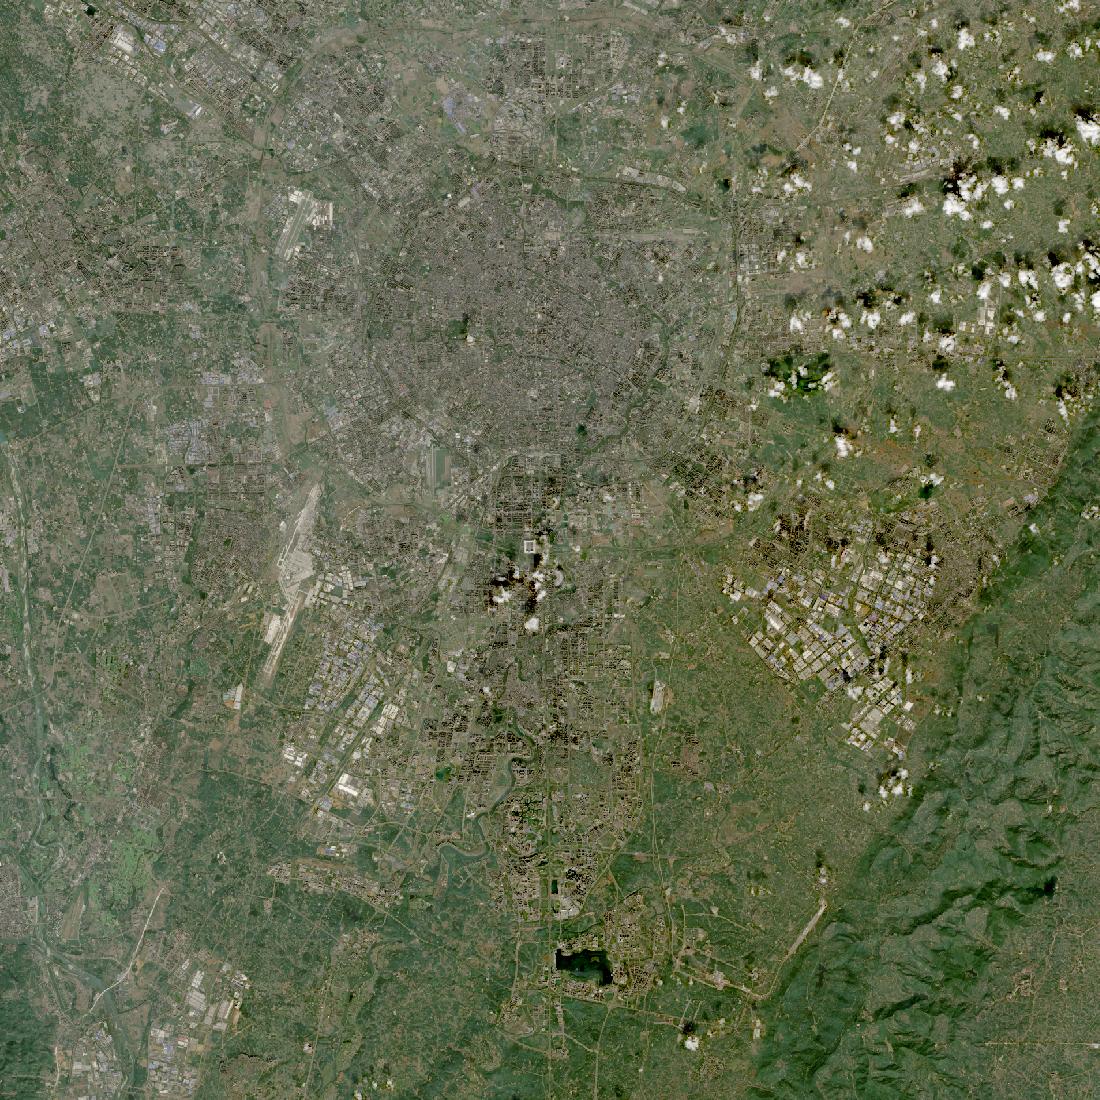 2024-10-2750 km50 km
- Built-up area
- 65 → 301 km²
- 4.6×
- People in frame
- 5.4M → 6.8M
- 1.2×
- People per km²
- 2,175 → 2,703
- Per square mile
- 5,634 → 7,002
Covers four and a half times more ground but holds only a fifth more people. The Sichuan basin is among the most densely farmed land on earth, so Chengdu expanded across villages rather than onto empty fields. No city here added more ground relative to its size, and few added fewer people.
Chongqing
grew in step
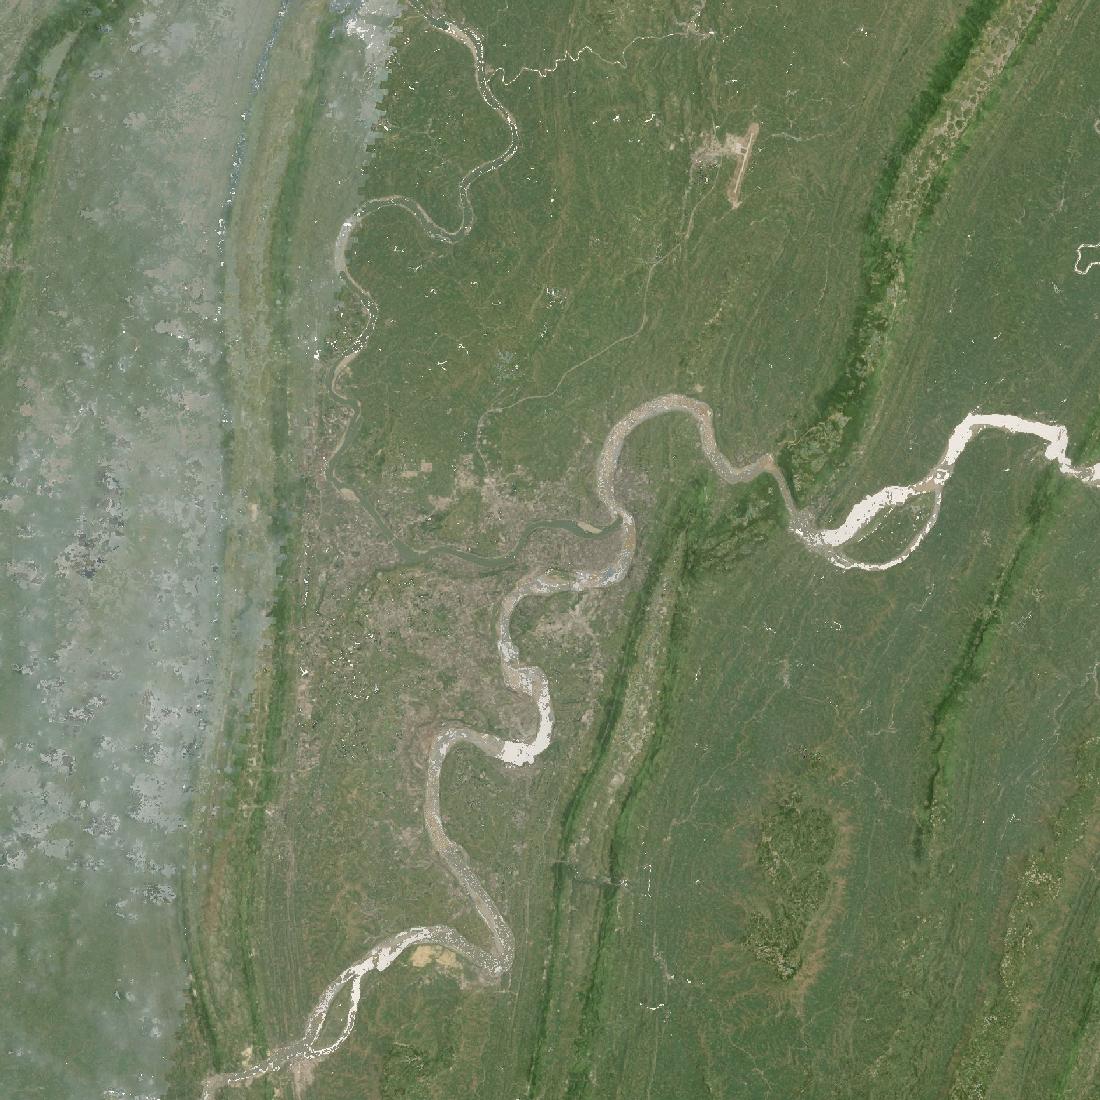 199050 km50 km
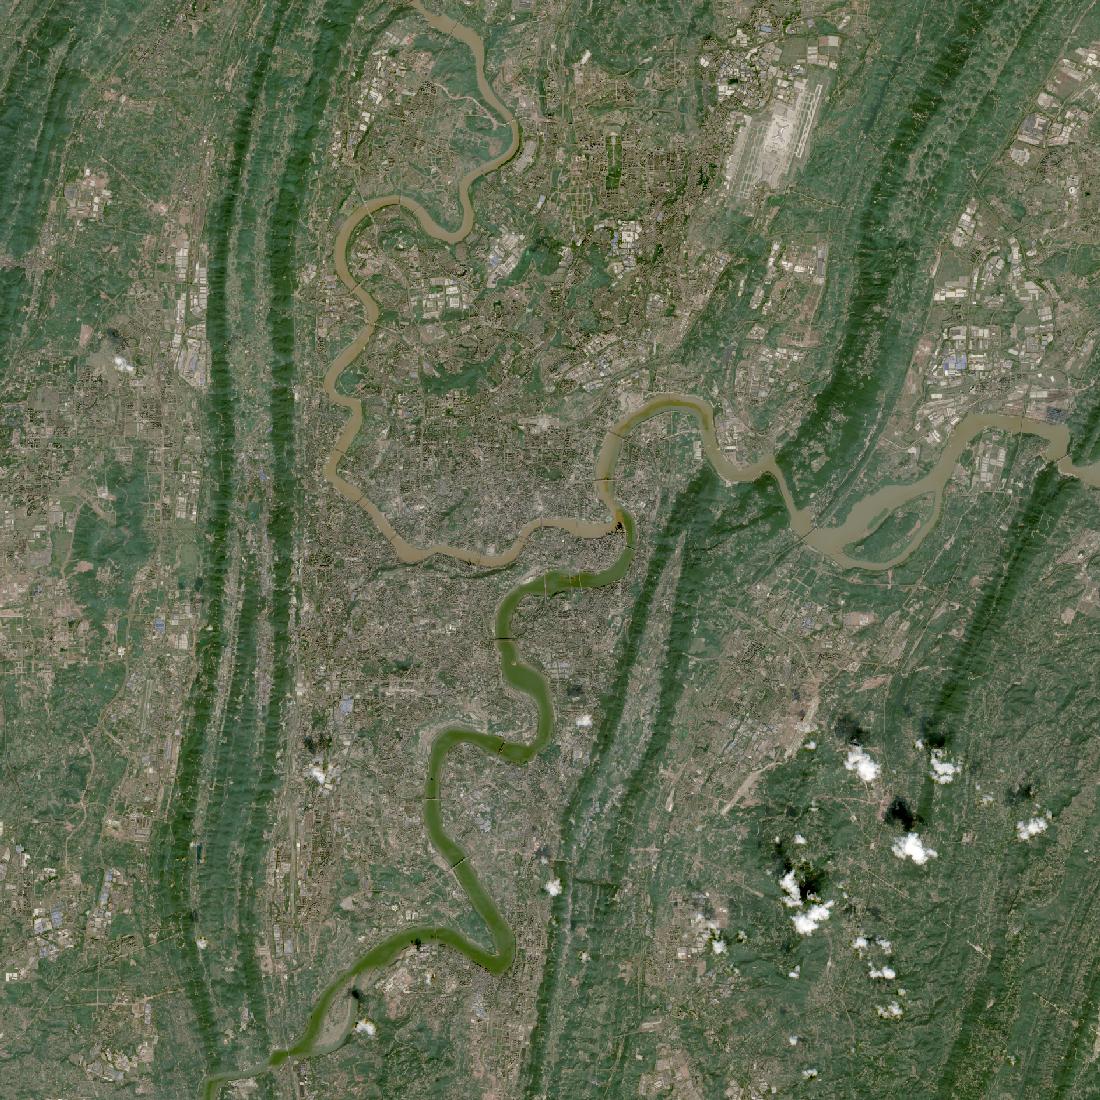 2025-10-1150 km50 km
- Built-up area
- 56 → 209 km²
- 3.7×
- People in frame
- 3.3M → 10.0M
- 3.0×
- People per km²
- 1,338 → 3,985
- Per square mile
- 3,467 → 10,324
Built into river gorges and hillsides, terrain that makes every new district expensive. Ground and population grew at close to the same rate, which is what it looks like when a city adds residents and the buildings to house them at the same time.
Ho Chi Minh City
grew in step
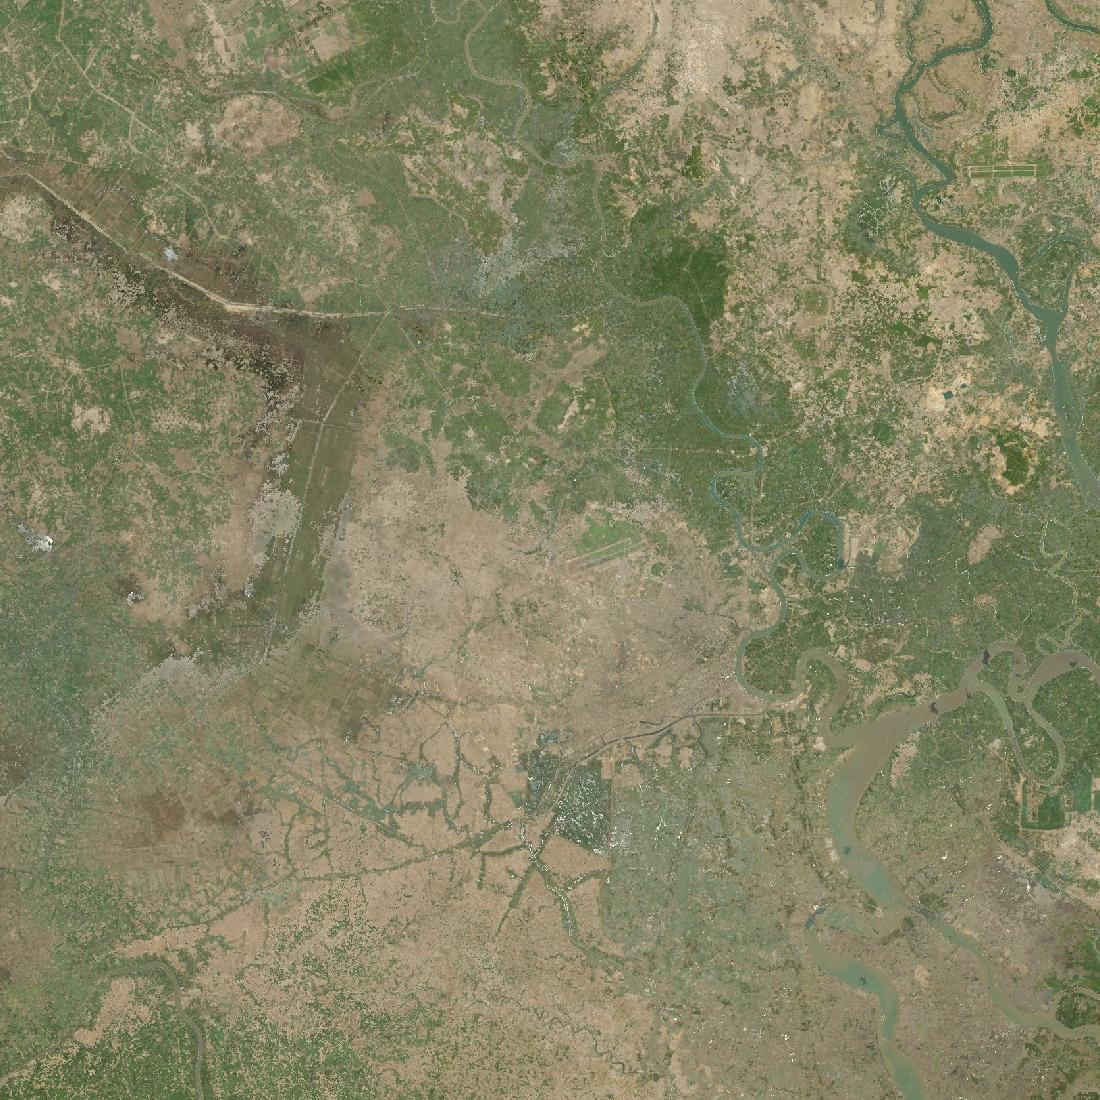 199050 km50 km
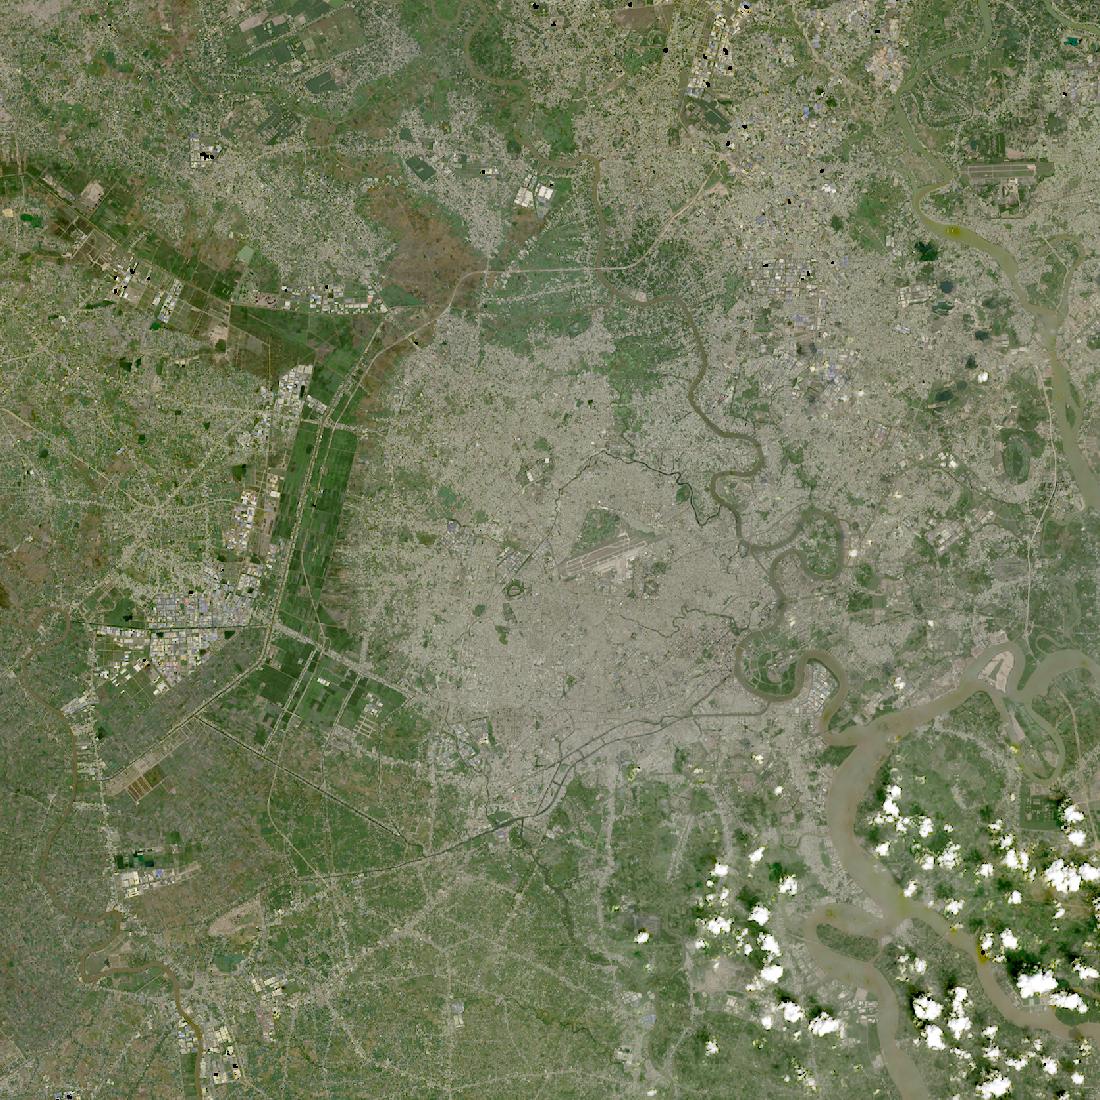 2025-12-2150 km50 km
- Built-up area
- 122 → 385 km²
- 3.1×
- People in frame
- 4.5M → 14.5M
- 3.2×
- People per km²
- 1,811 → 5,787
- Per square mile
- 4,693 → 14,992
The fourth most construction on this list. The Mekong delta is flat, wet and heavily farmed, and the city has spread across it at almost exactly the rate people arrived.
Chennai
absorbed its hinterland
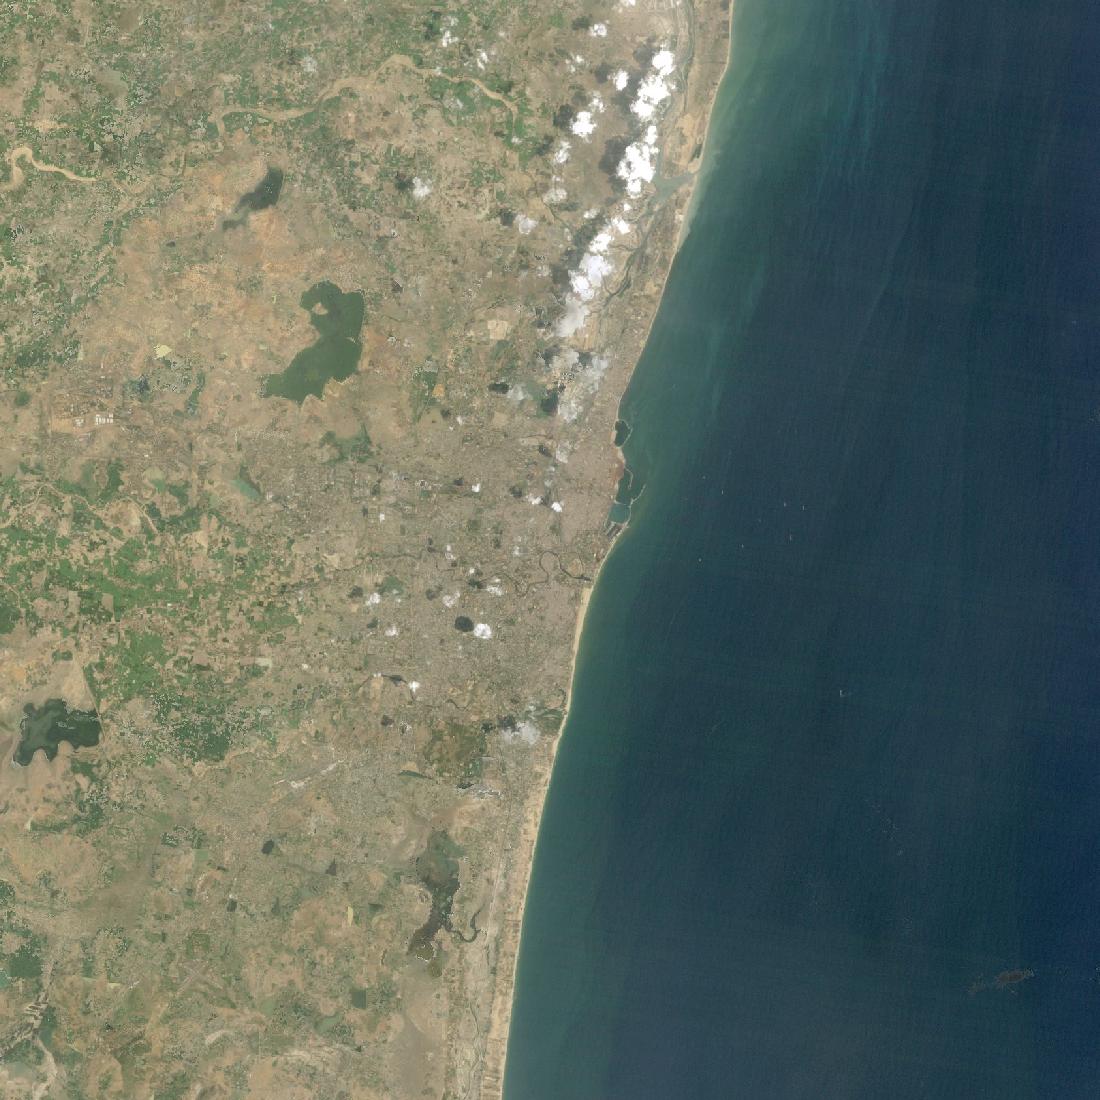 199050 km50 km
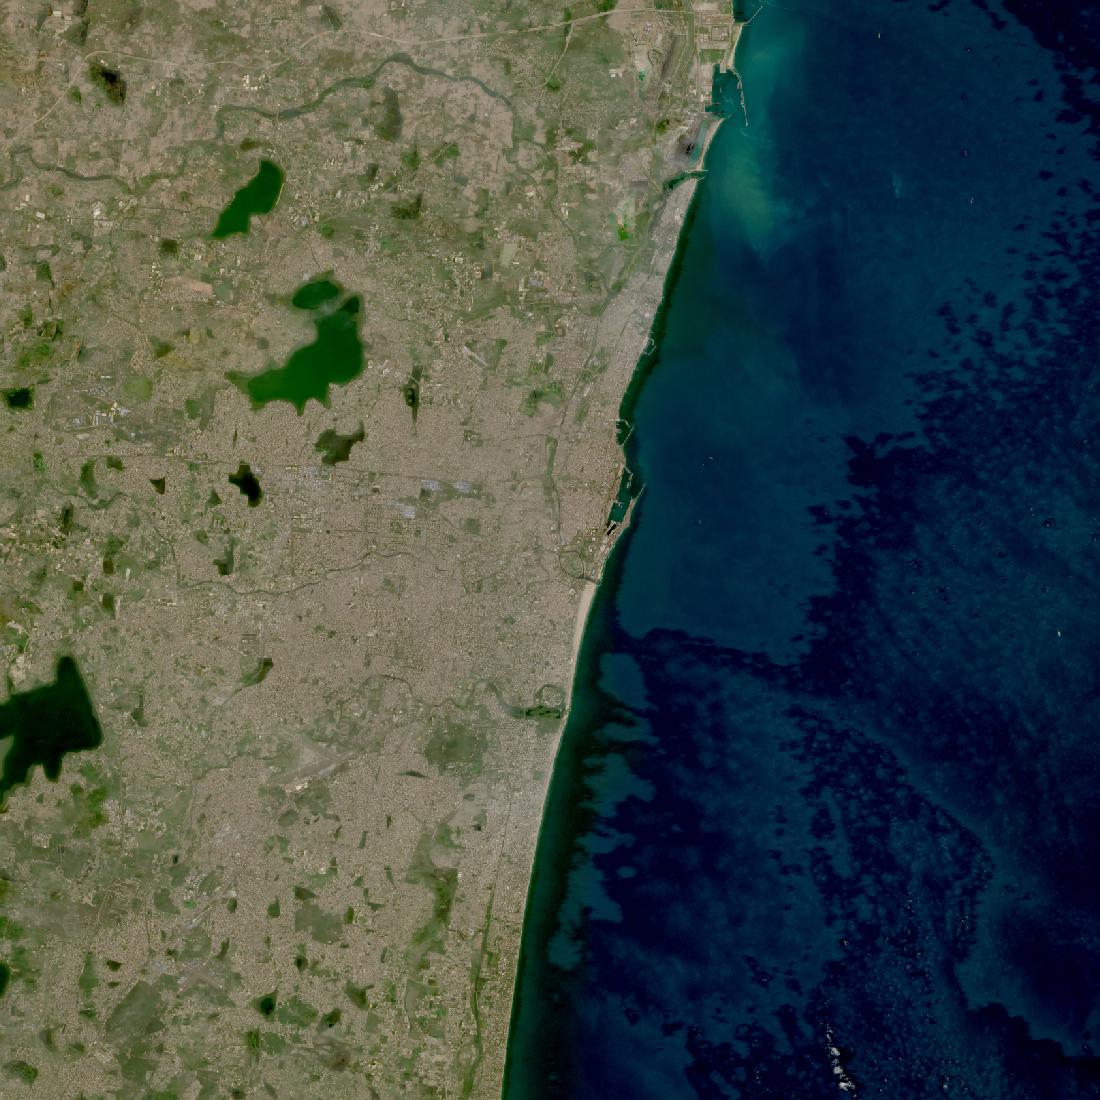 2026-02-0850 km50 km
- Built-up area
- 84 → 222 km²
- 2.7×
- People in frame
- 6.7M → 11.1M
- 1.6×
- People per km²
- 2,690 → 4,421
- Per square mile
- 6,969 → 11,454
Coastal Tamil Nadu was already thickly settled, so much of the new ground went over existing villages rather than empty land. The same pattern as Chengdu, less extreme.
Shanghai
built up more than out
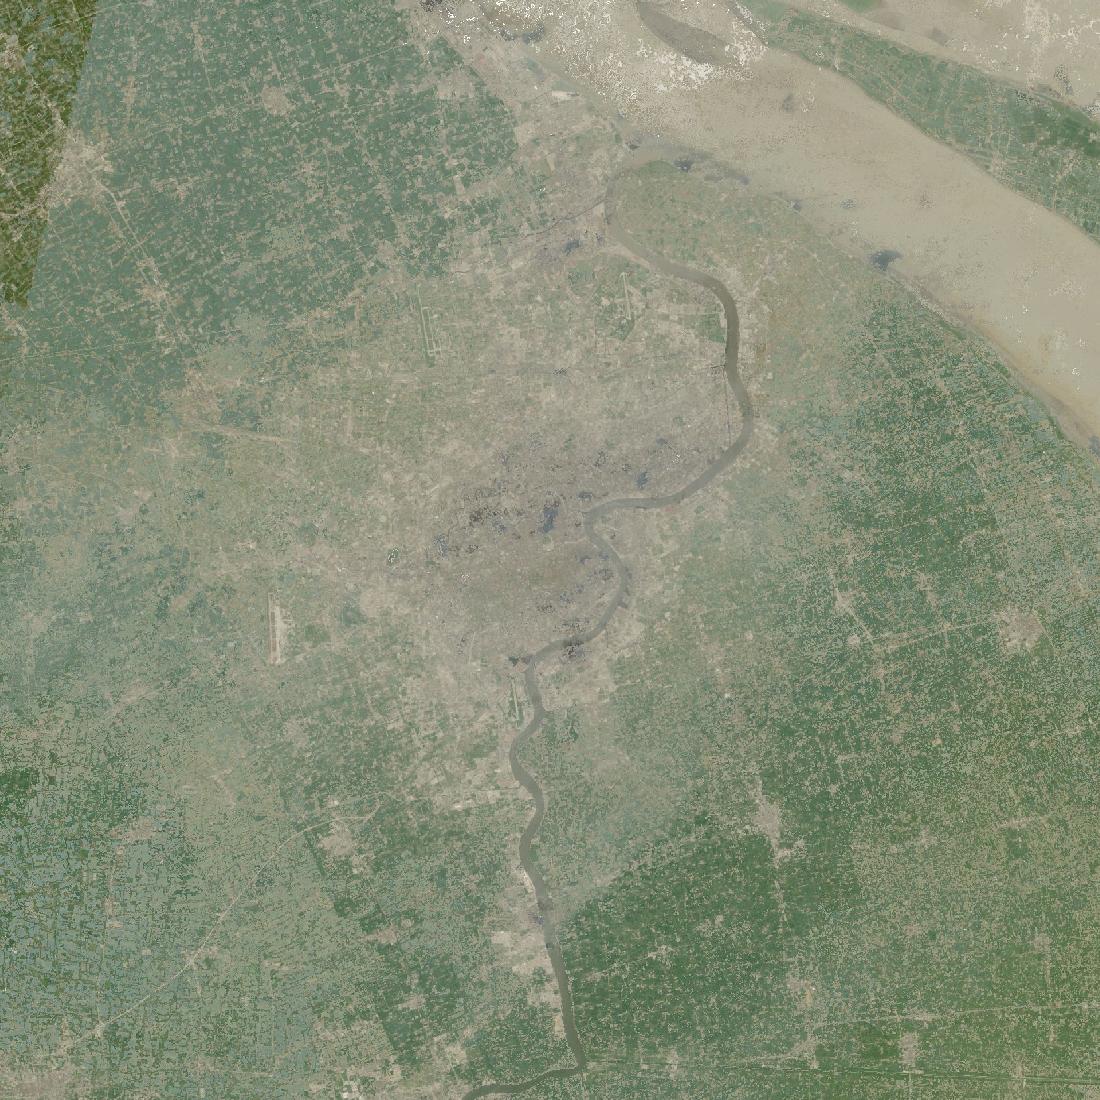 199050 km50 km
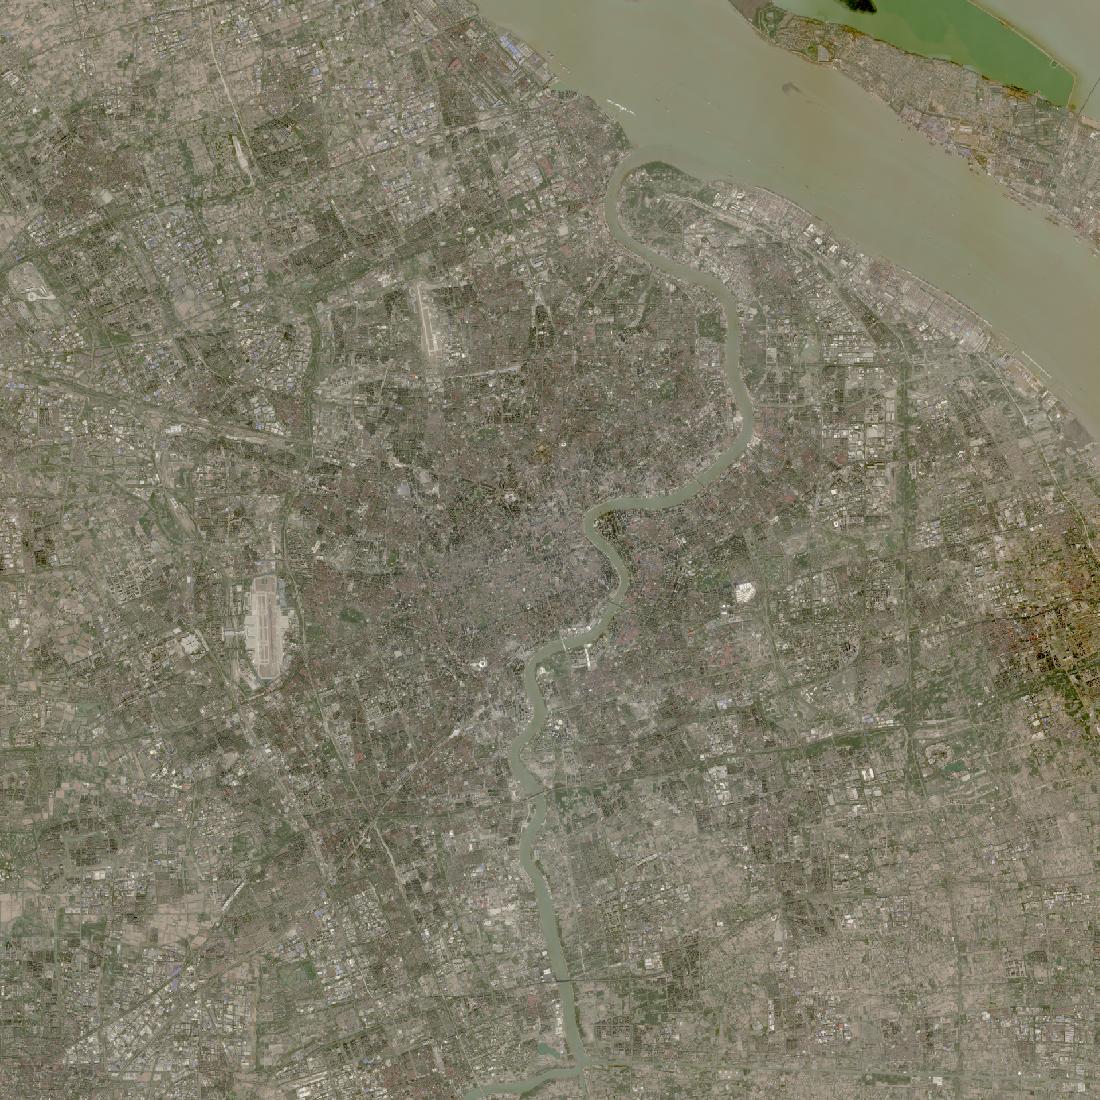 2025-11-2850 km50 km
- Built-up area
- 216 → 545 km²
- 2.5×
- People in frame
- 7.9M → 26.5M
- 3.3×
- People per km²
- 3,174 → 10,581
- Per square mile
- 8,222 → 27,413
Pudong, across the river from the old city, was farmland and warehouses in the older frame. Population grew faster than footprint, so the average resident lives more densely than in 1990.
Dubai
built on empty land
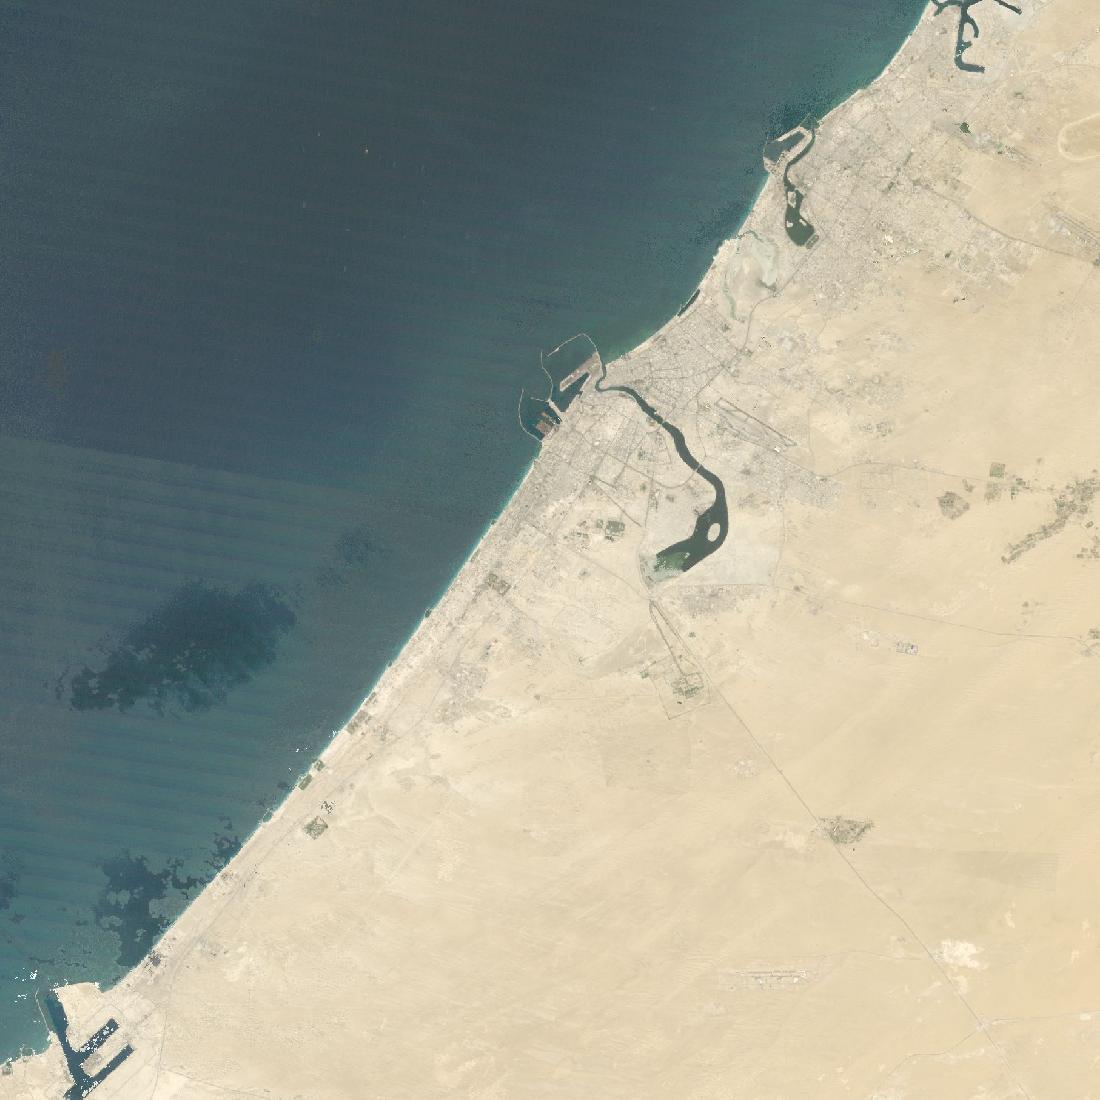 199050 km50 km
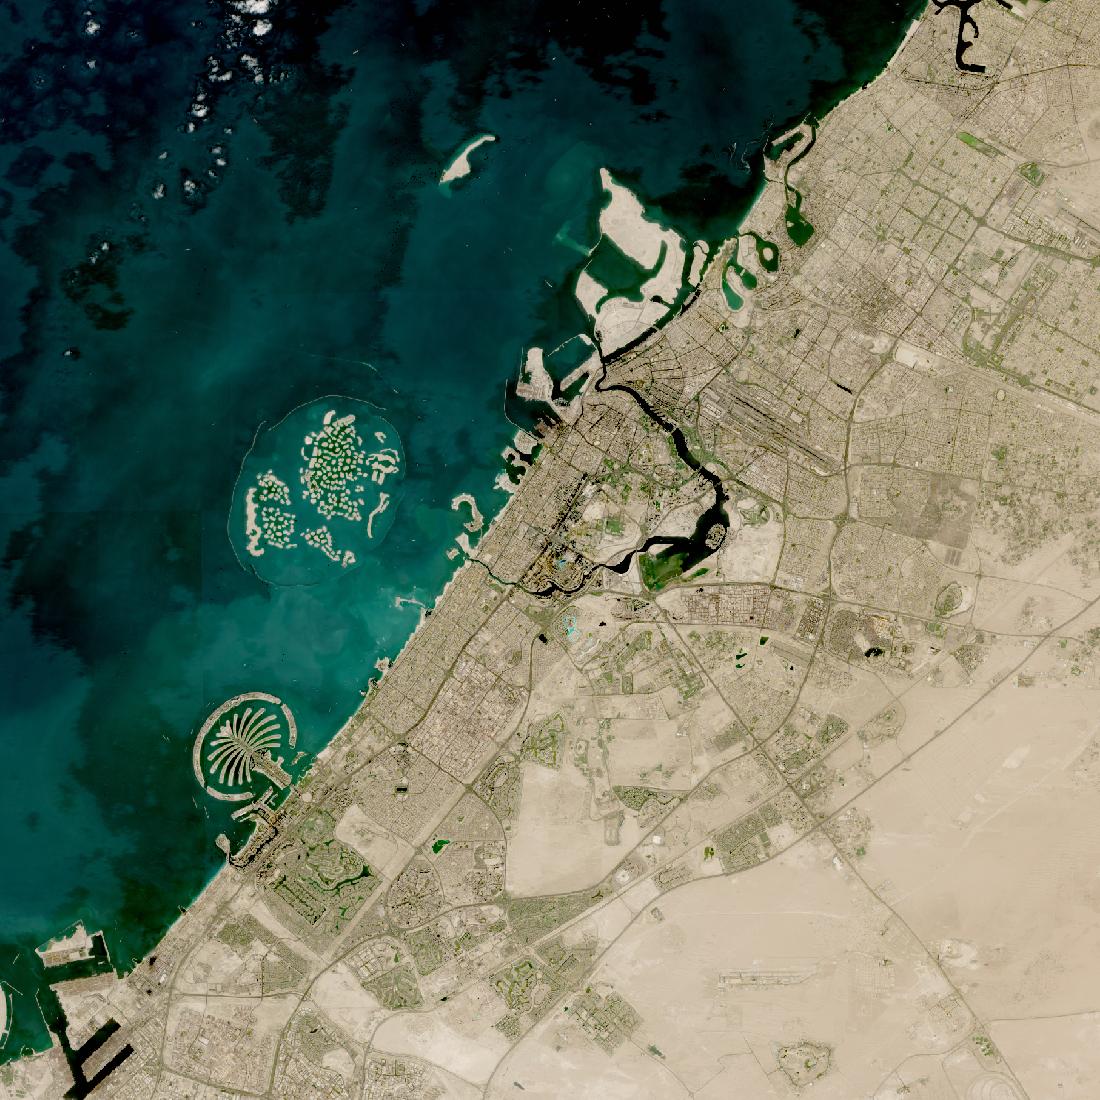 2025-10-1150 km50 km
- Built-up area
- 90 → 209 km²
- 2.3×
- People in frame
- 777k → 4.4M
- 5.7×
- People per km²
- 311 → 1,777
- Per square mile
- 806 → 4,604
The largest population multiple here, nearly six-fold, on 2.3 times the ground. It built outward into desert with nothing in the way, and upward fast enough that people accumulated quicker than area.
Bangkok
grew in step
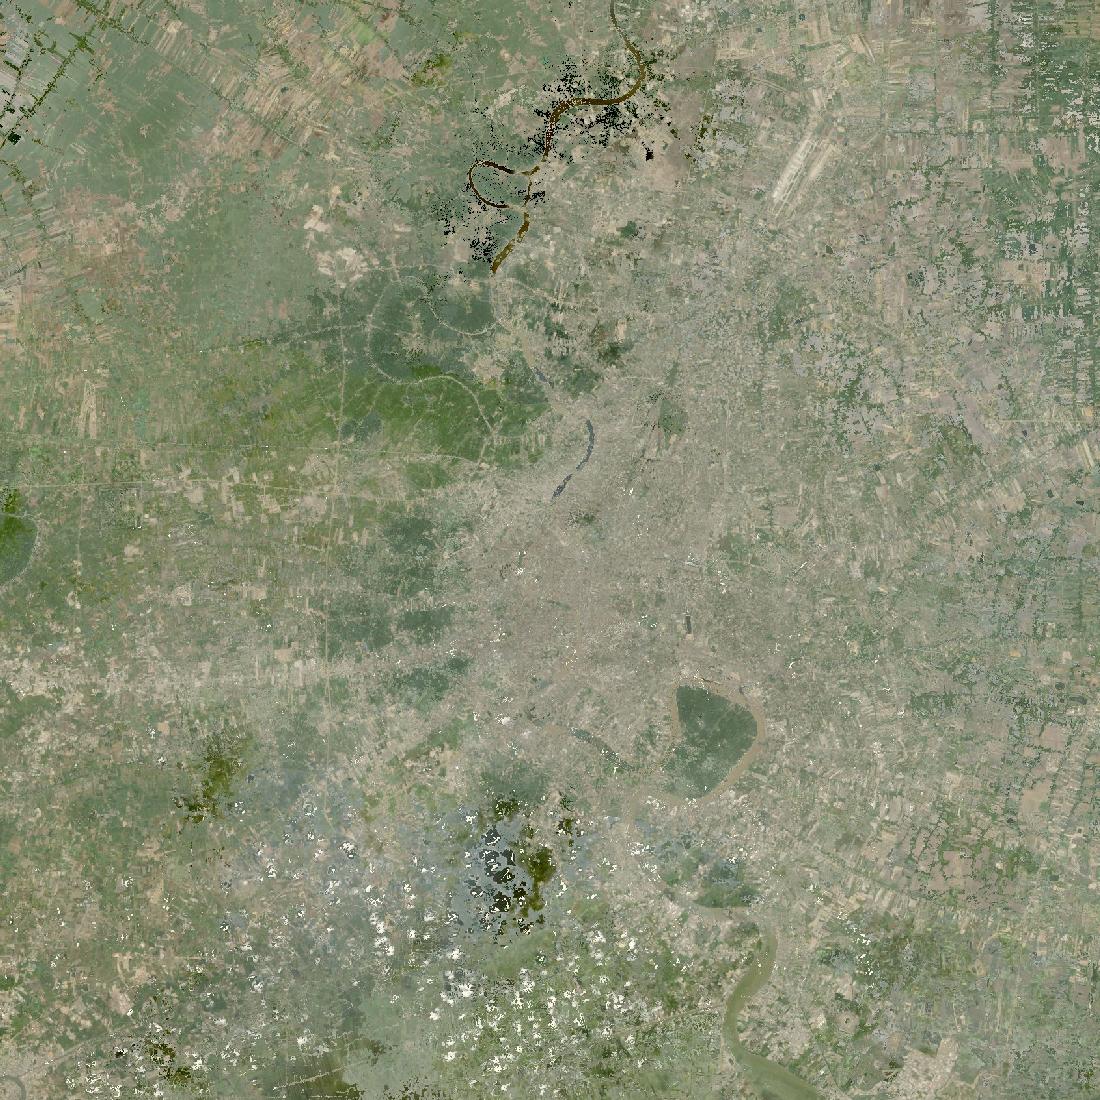 199050 km50 km
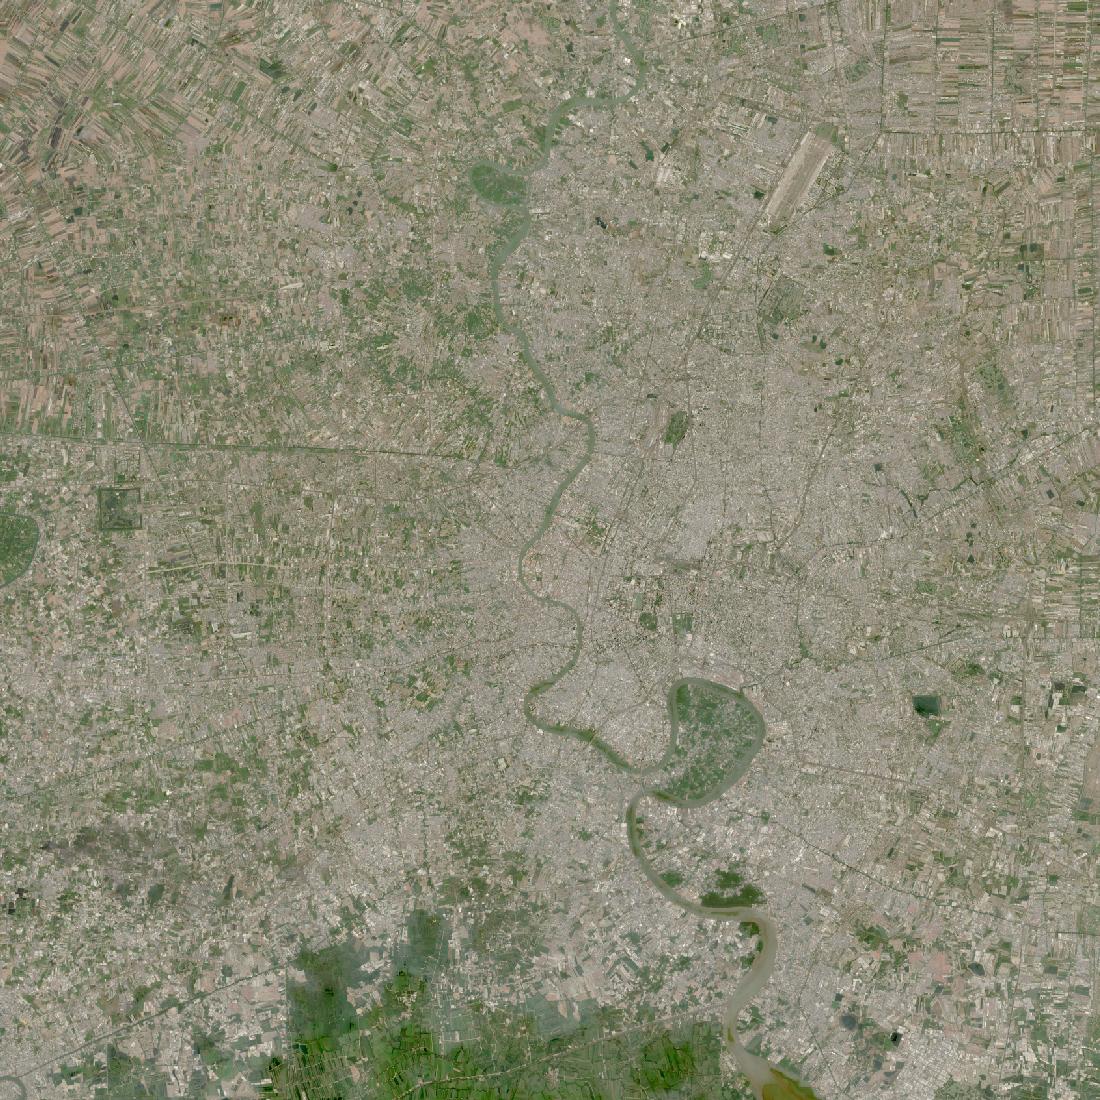 2026-04-0550 km50 km
- Built-up area
- 252 → 559 km²
- 2.2×
- People in frame
- 6.8M → 17.3M
- 2.5×
- People per km²
- 2,713 → 6,927
- Per square mile
- 7,028 → 17,945
Spread along the Chao Phraya and its canal network at roughly the pace people arrived.
Beijing
grew in step
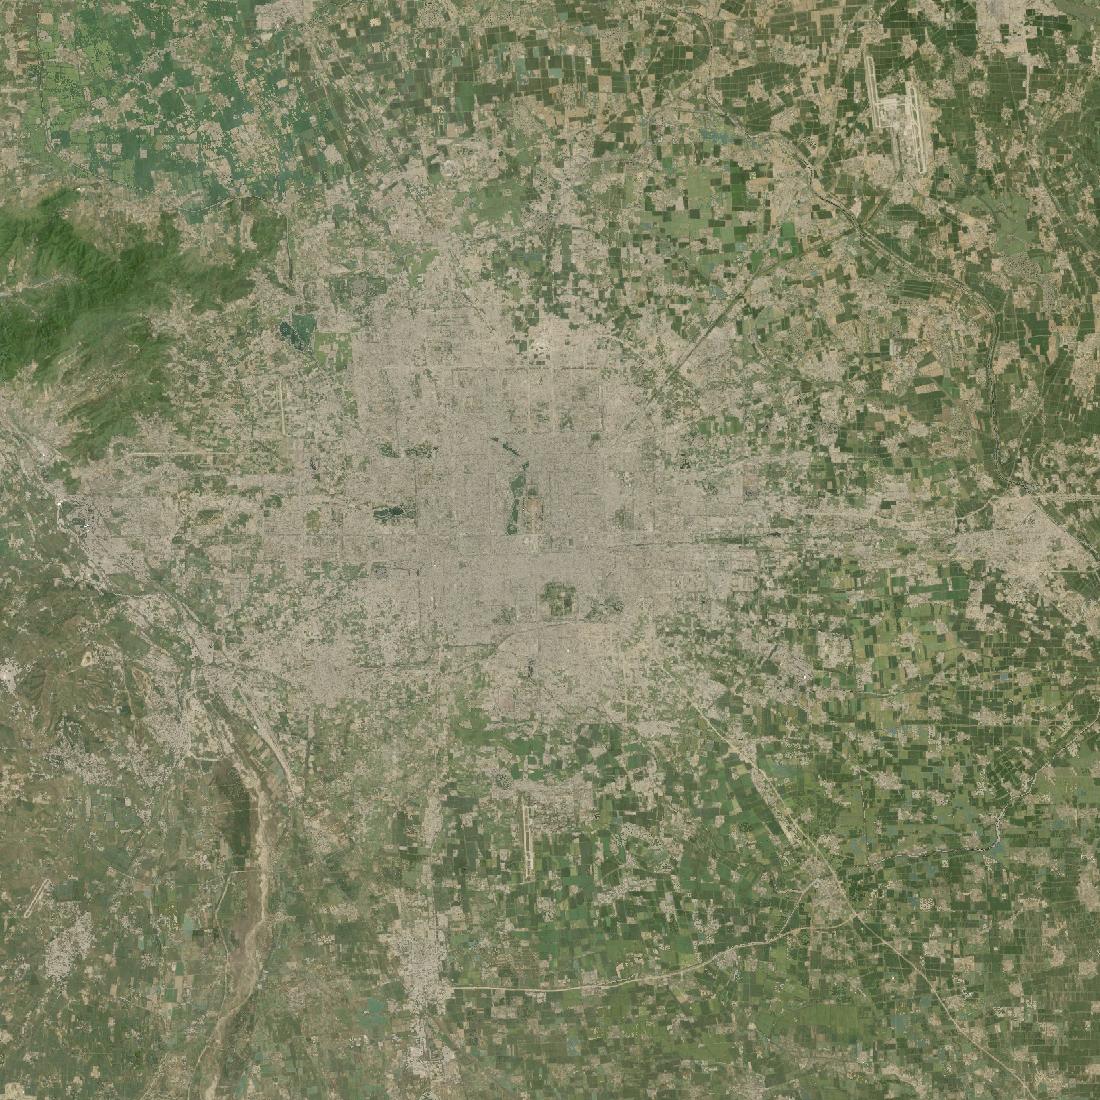 199050 km50 km
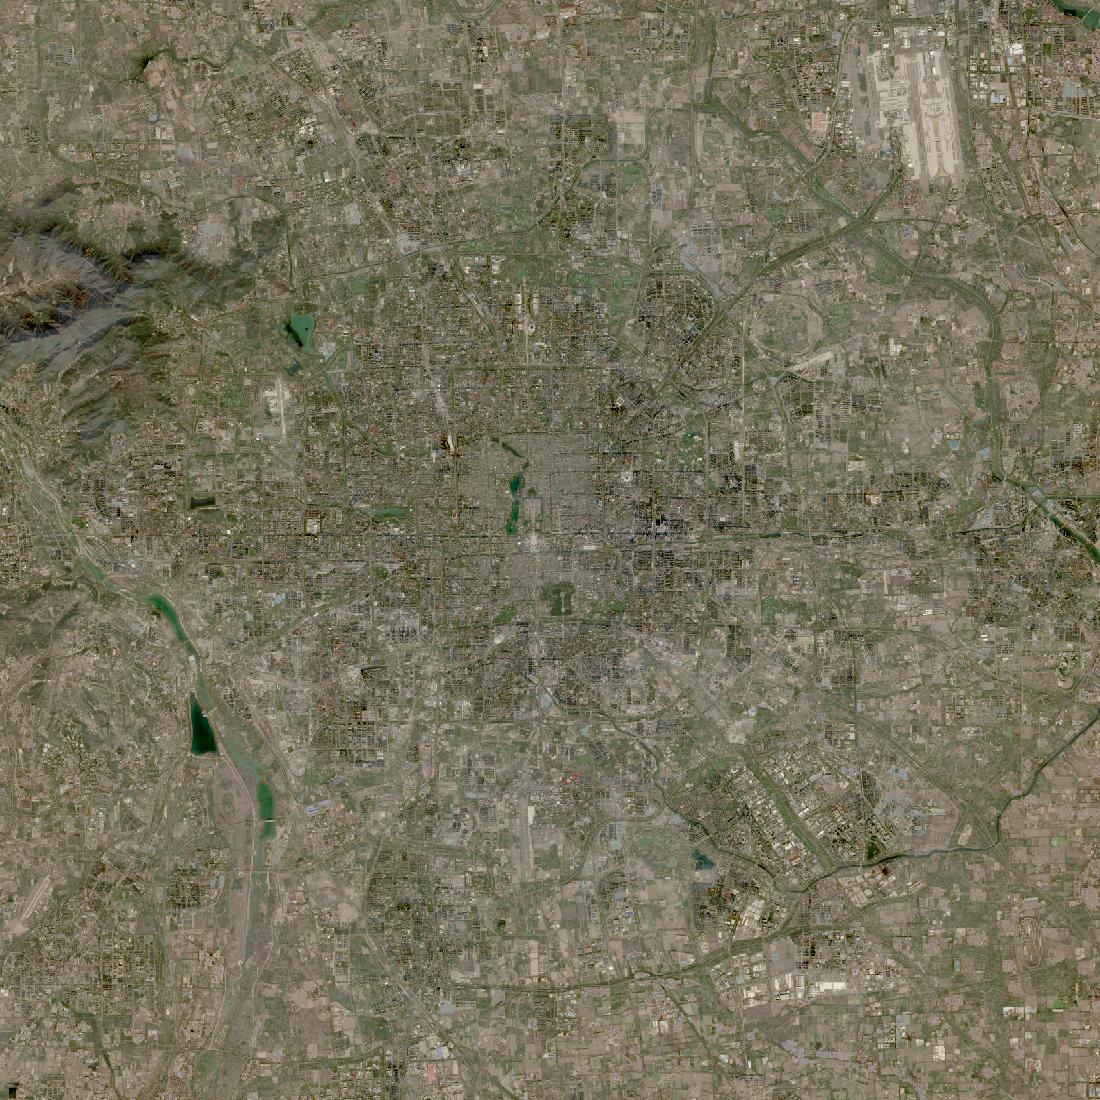 2025-11-0450 km50 km
- Built-up area
- 273 → 562 km²
- 2.1×
- People in frame
- 7.6M → 17.7M
- 2.3×
- People per km²
- 3,047 → 7,099
- Per square mile
- 7,895 → 18,391
Ring roads added outward across the flat plain, with ground and population closely matched.
Cairo
grew in step
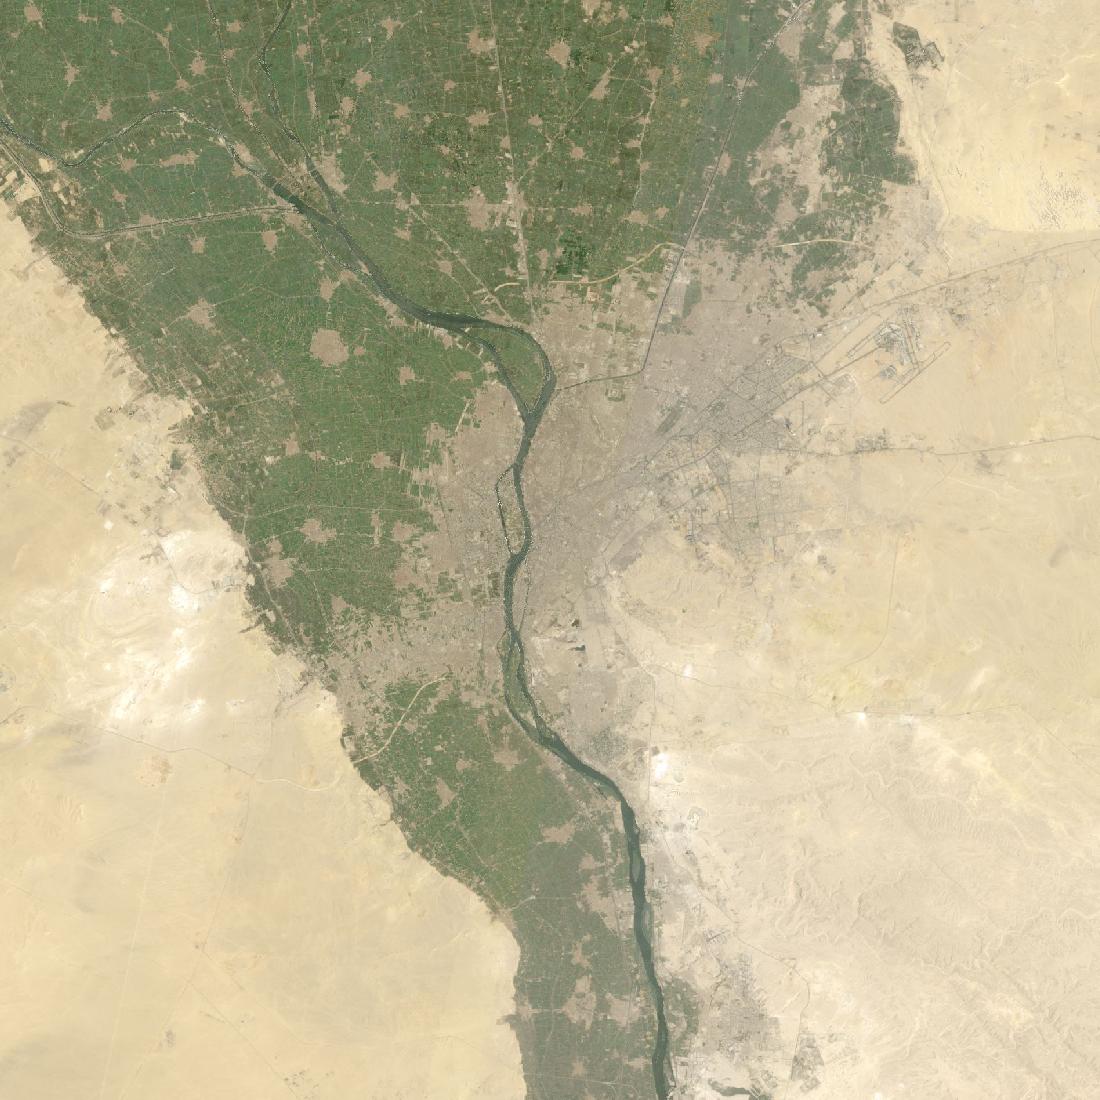 199050 km50 km
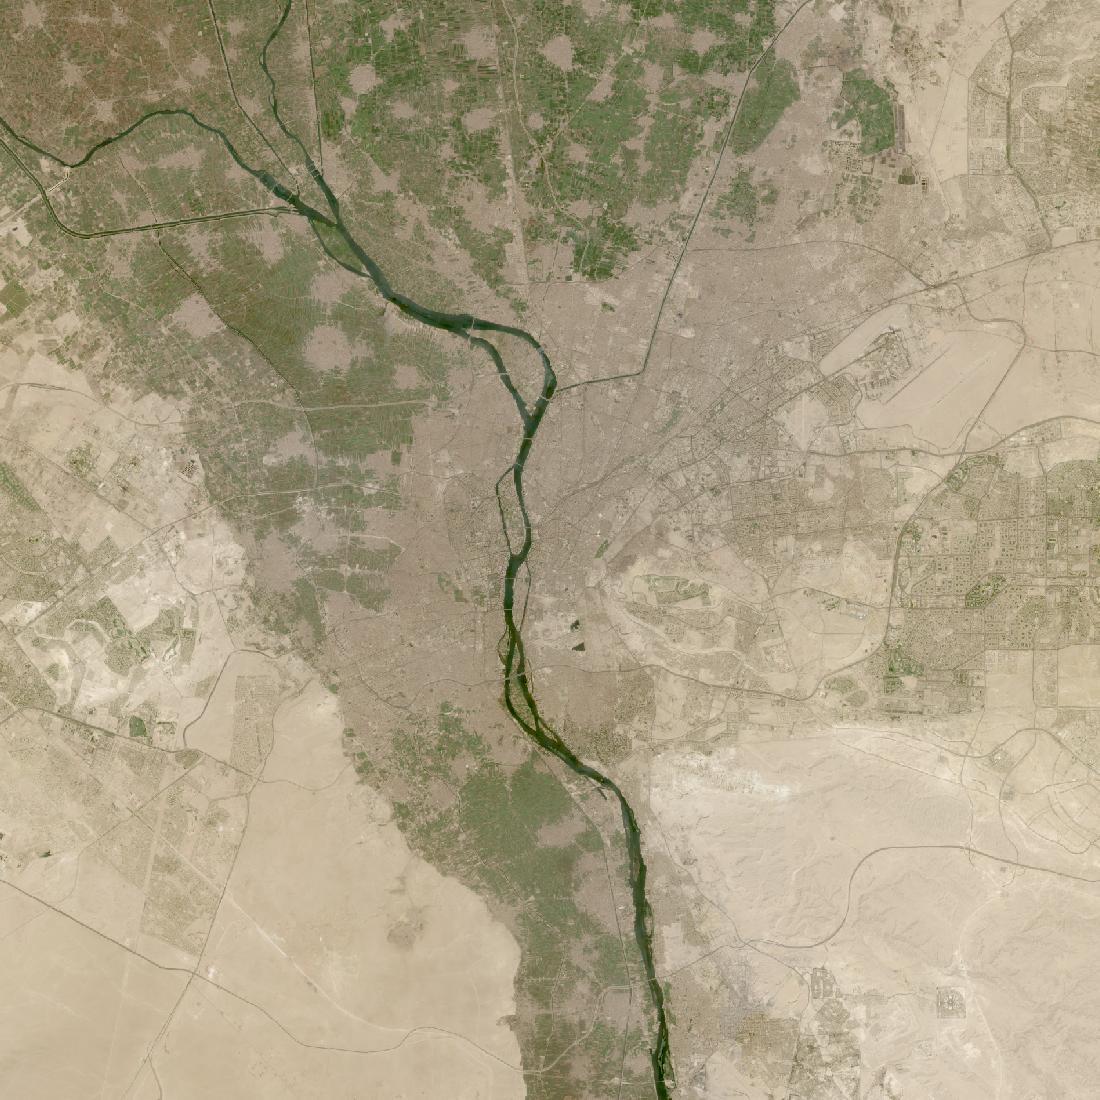 2024-09-0950 km50 km
- Built-up area
- 191 → 391 km²
- 2.0×
- People in frame
- 11.9M → 24.5M
- 2.1×
- People per km²
- 4,741 → 9,812
- Per square mile
- 12,282 → 25,420
Egypt's habitable land is a thin ribbon along the Nile. Cairo doubled its footprint by climbing into the desert on both sides of the valley, which is why the new city reads as pale against the dark farmland.
Riyadh
built on empty land
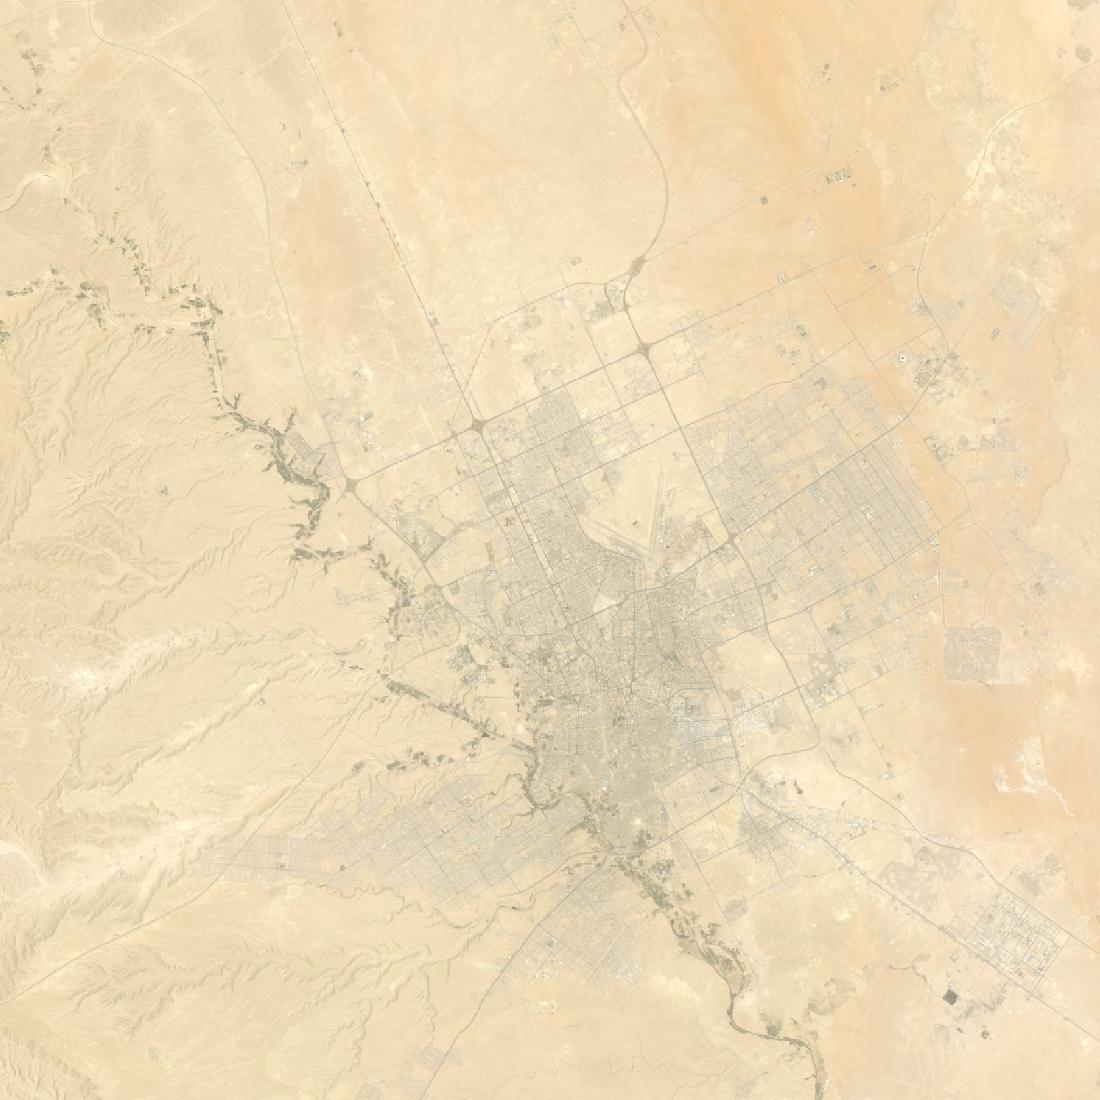 199050 km50 km
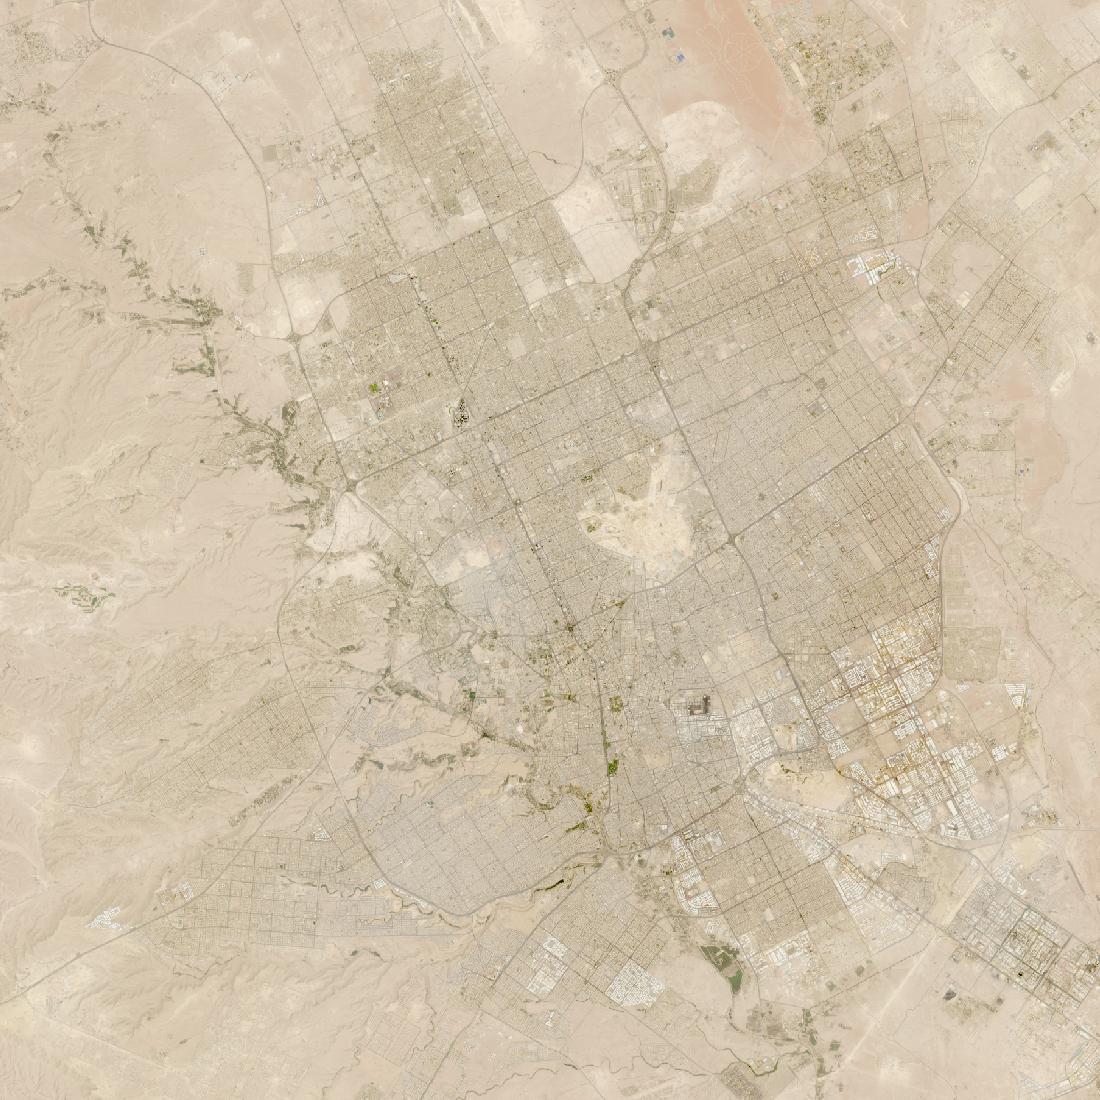 2025-09-0150 km50 km
- Built-up area
- 221 → 421 km²
- 1.9×
- People in frame
- 2.6M → 8.9M
- 3.4×
- People per km²
- 1,036 → 3,562
- Per square mile
- 2,683 → 9,228
Built into open desert with no farmland or villages to absorb. Population grew nearly twice as fast as area, so the newer districts are denser than the old core.
Tel Aviv
built on empty land
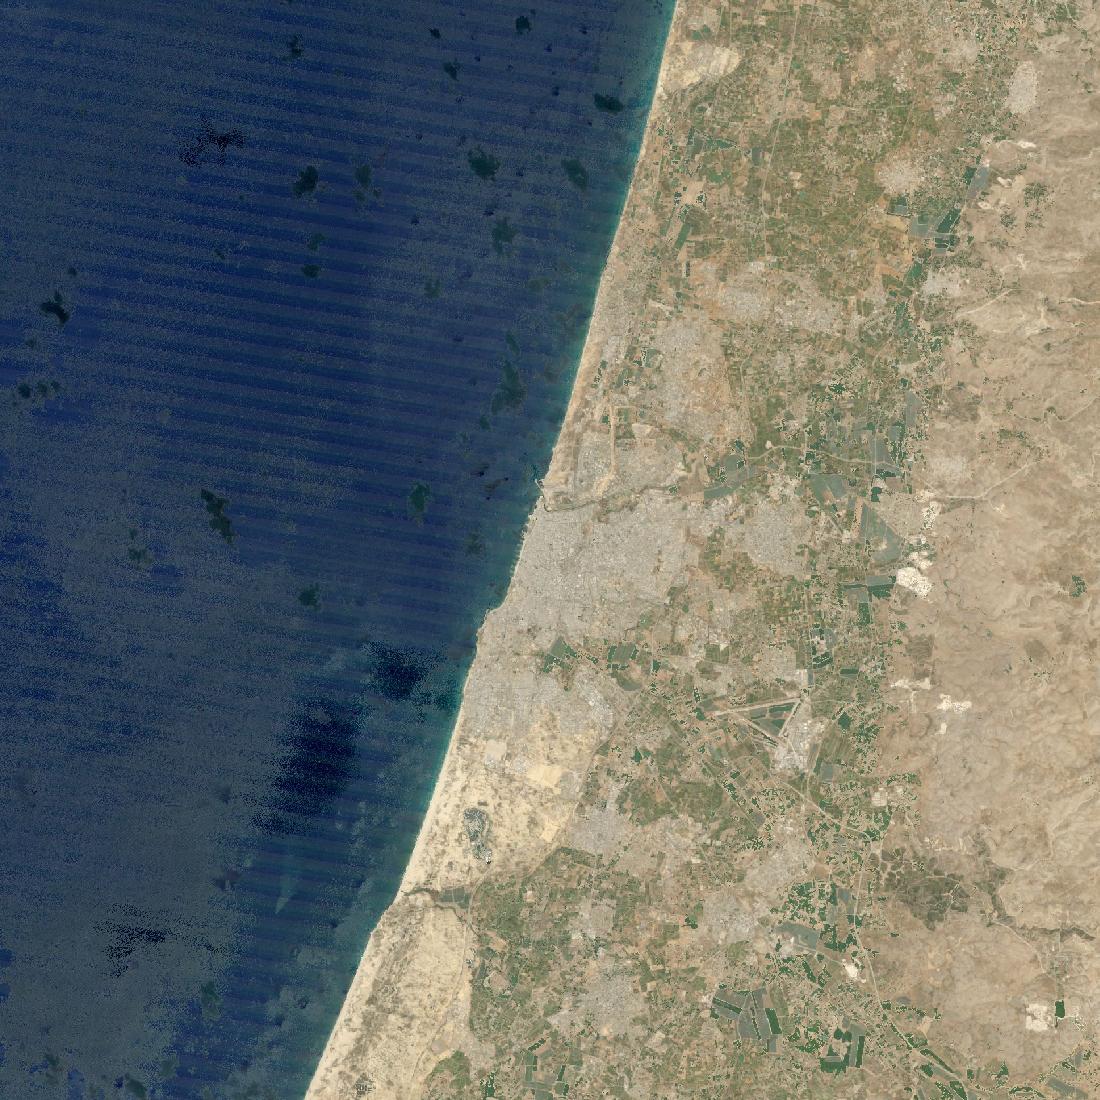 199050 km50 km
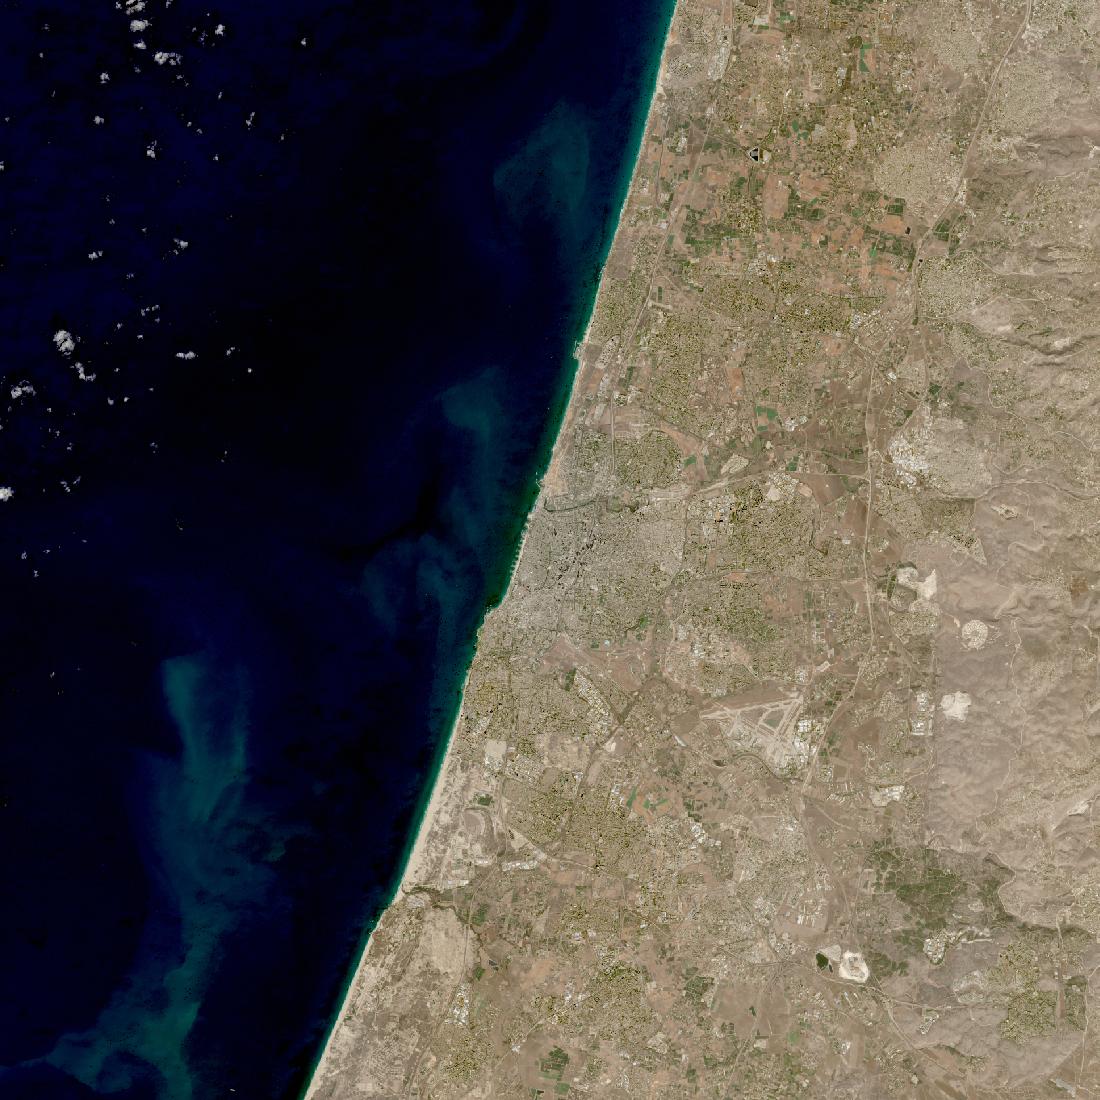 2025-10-1150 km50 km
- Built-up area
- 88 → 153 km²
- 1.7×
- People in frame
- 1.6M → 4.3M
- 2.6×
- People per km²
- 644 → 1,706
- Per square mile
- 1,668 → 4,421
The smallest footprint of any city here. It grew mostly by filling in, with people arriving faster than ground was added.
Delhi
built on empty land
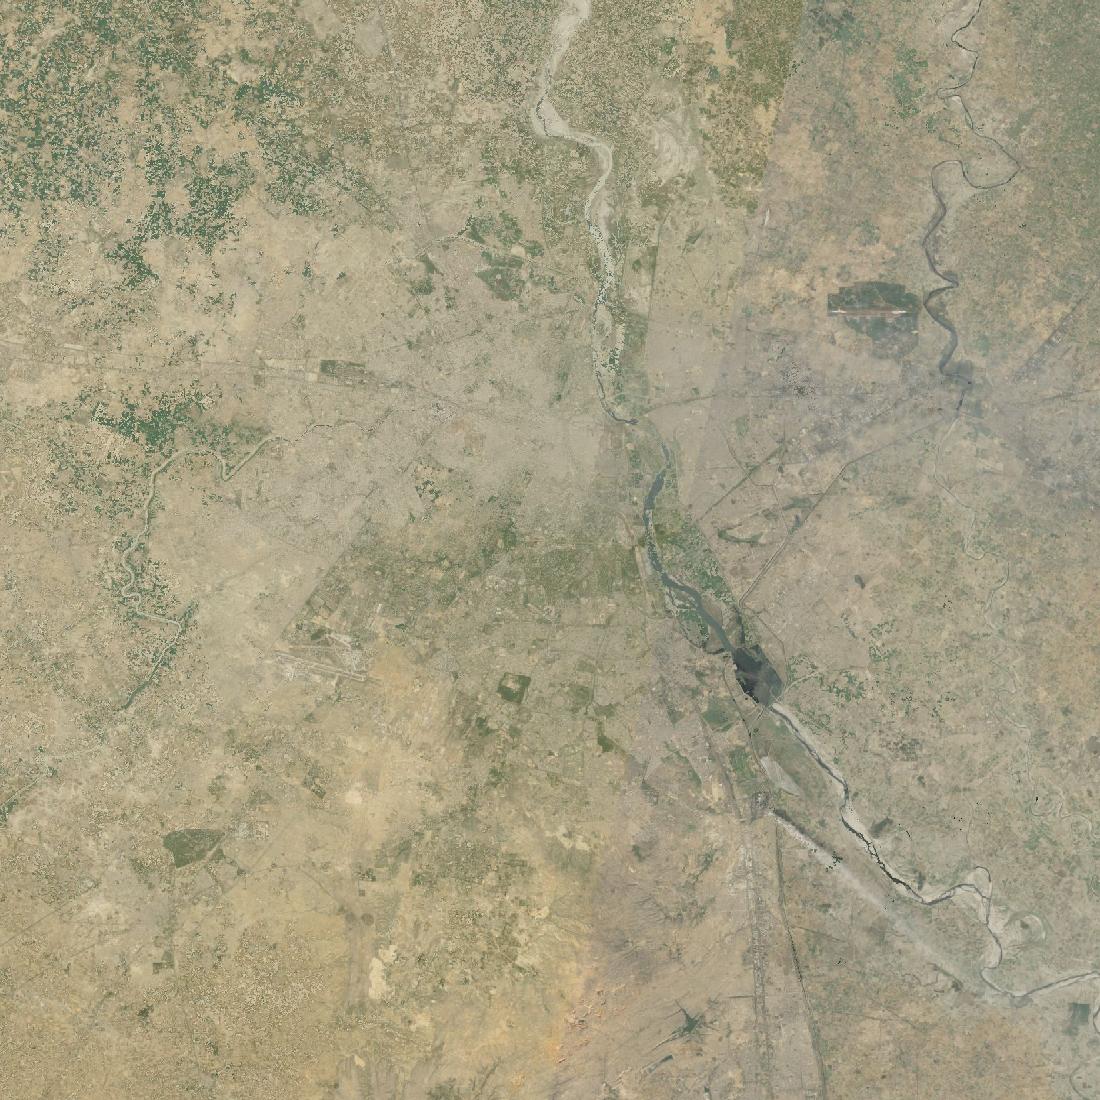 199050 km50 km
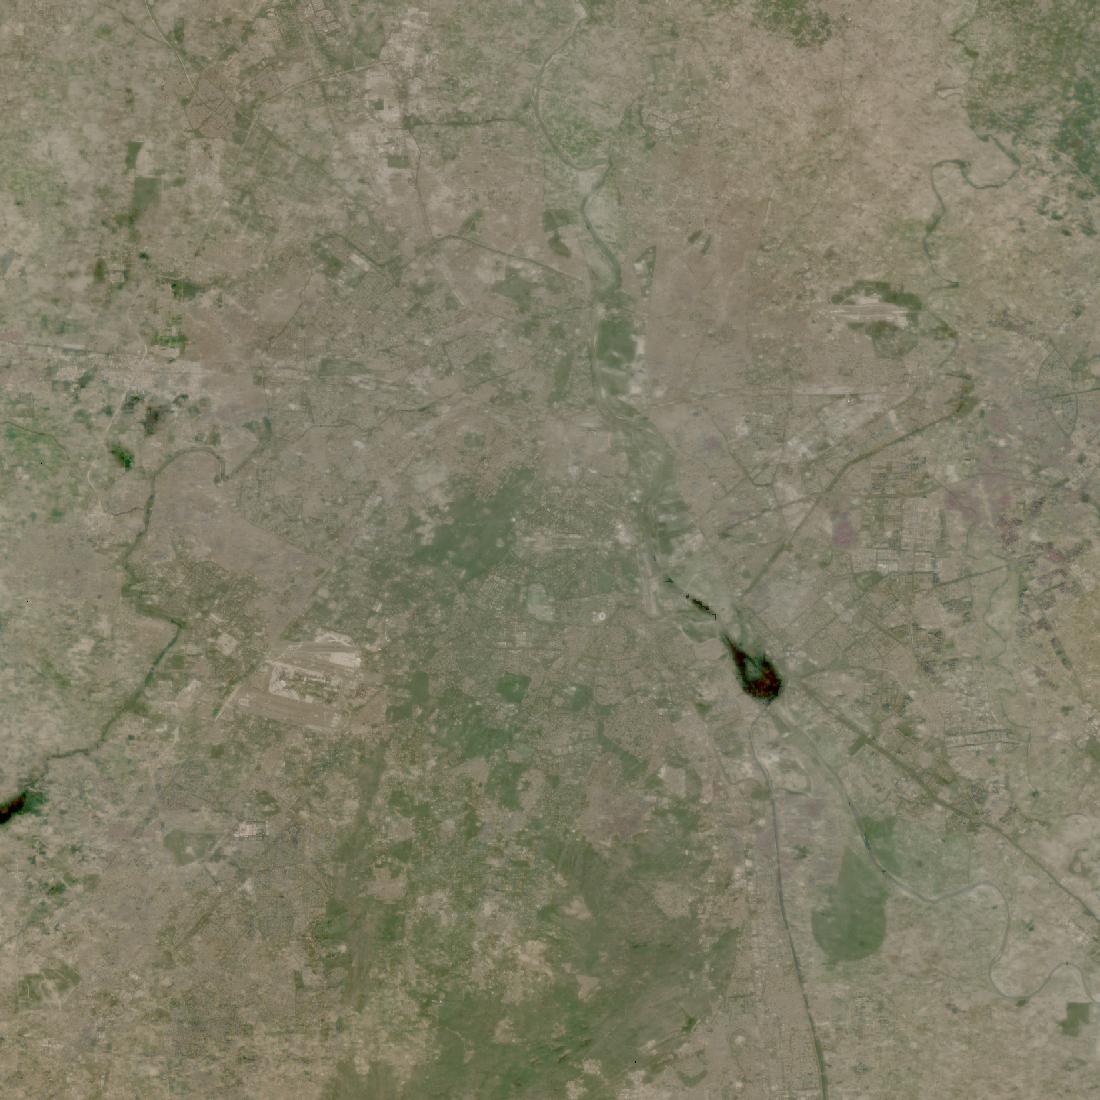 2024-11-0450 km50 km
- Built-up area
- 313 → 494 km²
- 1.6×
- People in frame
- 11.8M → 30.0M
- 2.5×
- People per km²
- 4,720 → 11,985
- Per square mile
- 12,228 → 31,049
Added more than 18 million people inside the frame on only 1.6 times the ground. The result is the second densest place measured here, after Cairo.
Houston
built up more than out
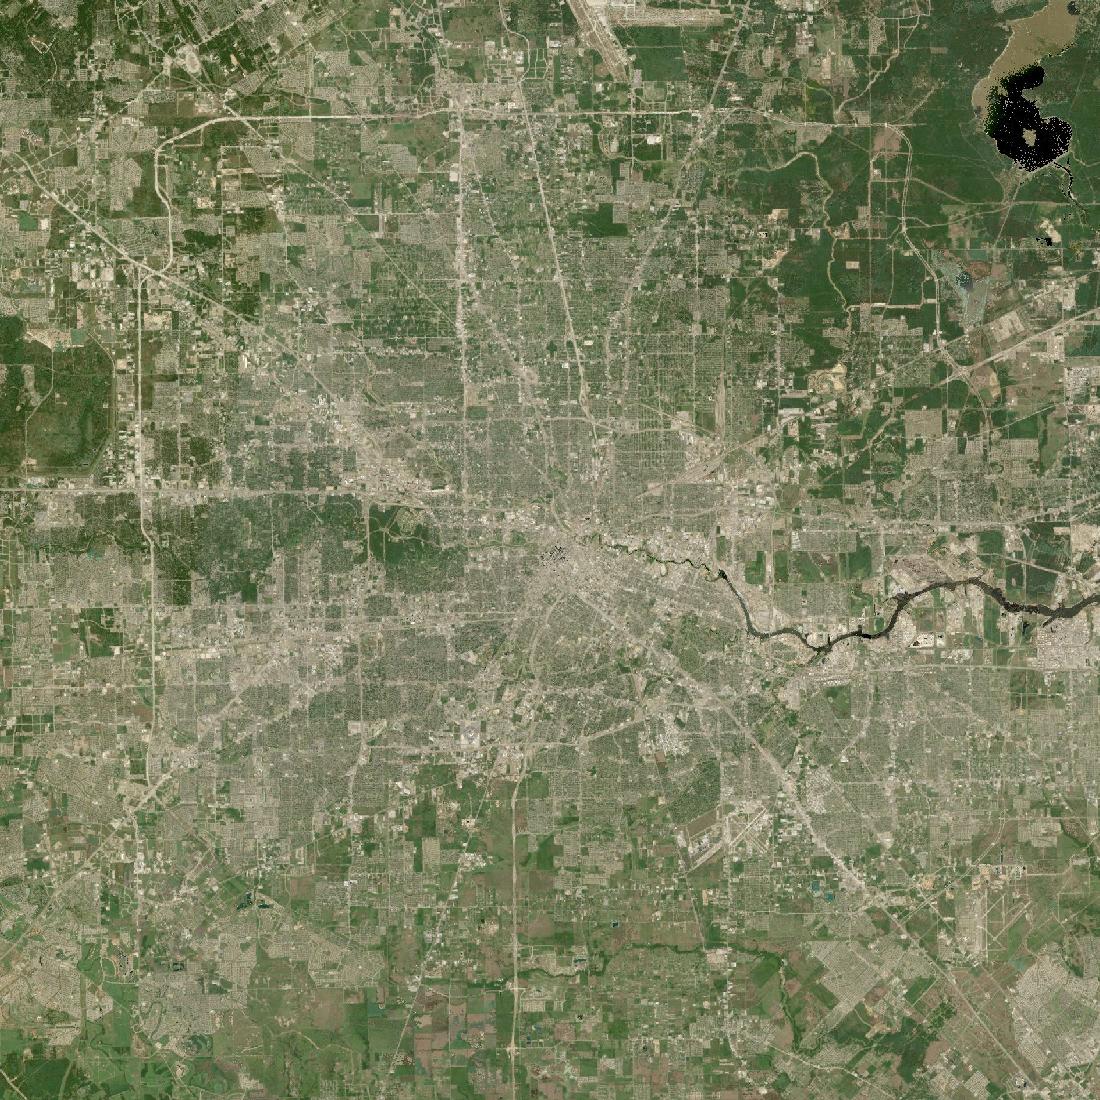 199050 km50 km
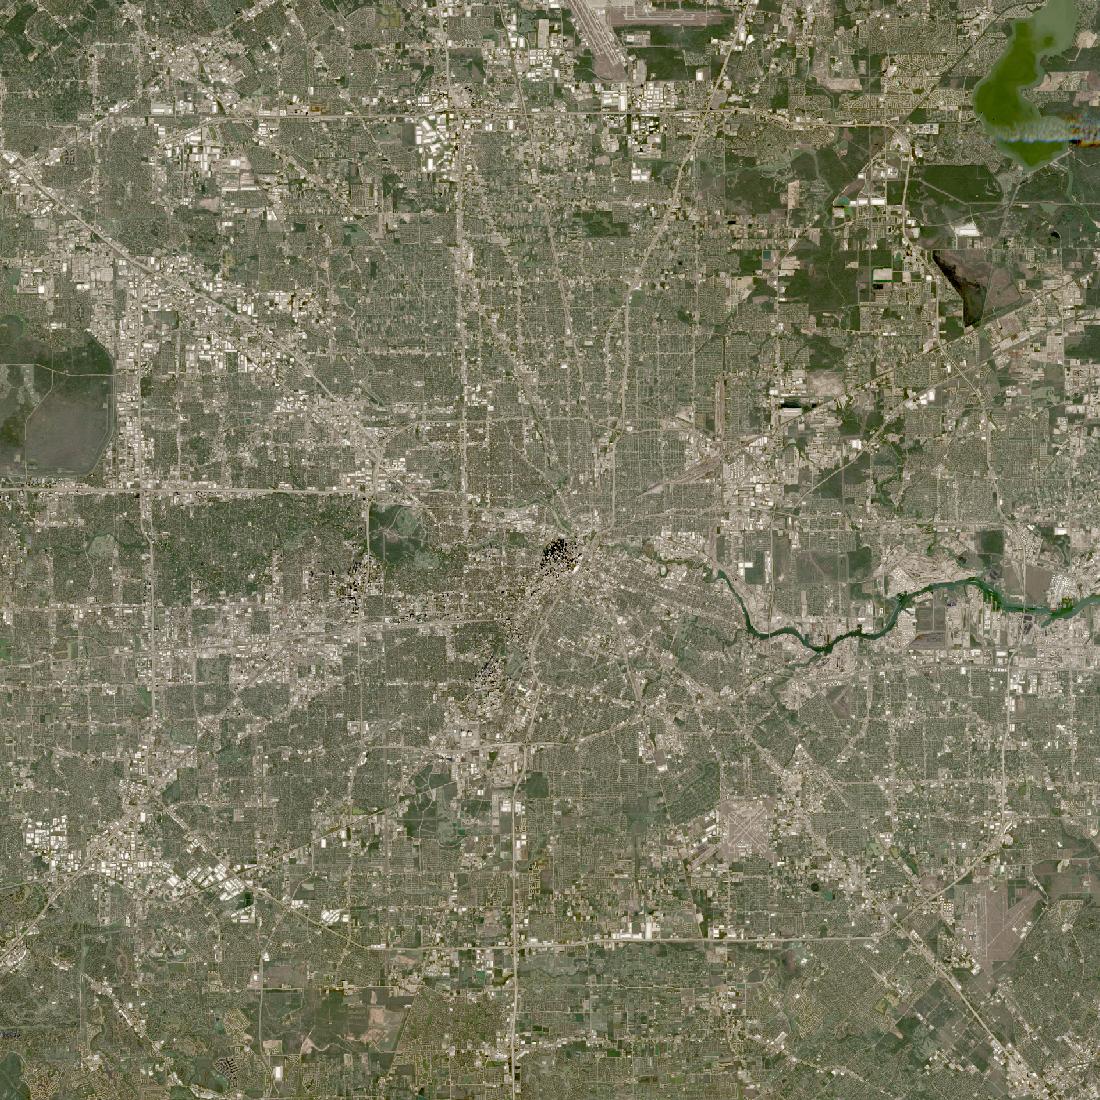 2024-12-0650 km50 km
- Built-up area
- 276 → 430 km²
- 1.6×
- People in frame
- 2.0M → 4.1M
- 2.0×
- People per km²
- 808 → 1,648
- Per square mile
- 2,094 → 4,269
Sprawl with very little in the way: flat land in every direction and no zoning of the conventional kind. It added half again as much ground and twice as many people, so even Houston is denser than it was.
Sao Paulo
grew in step
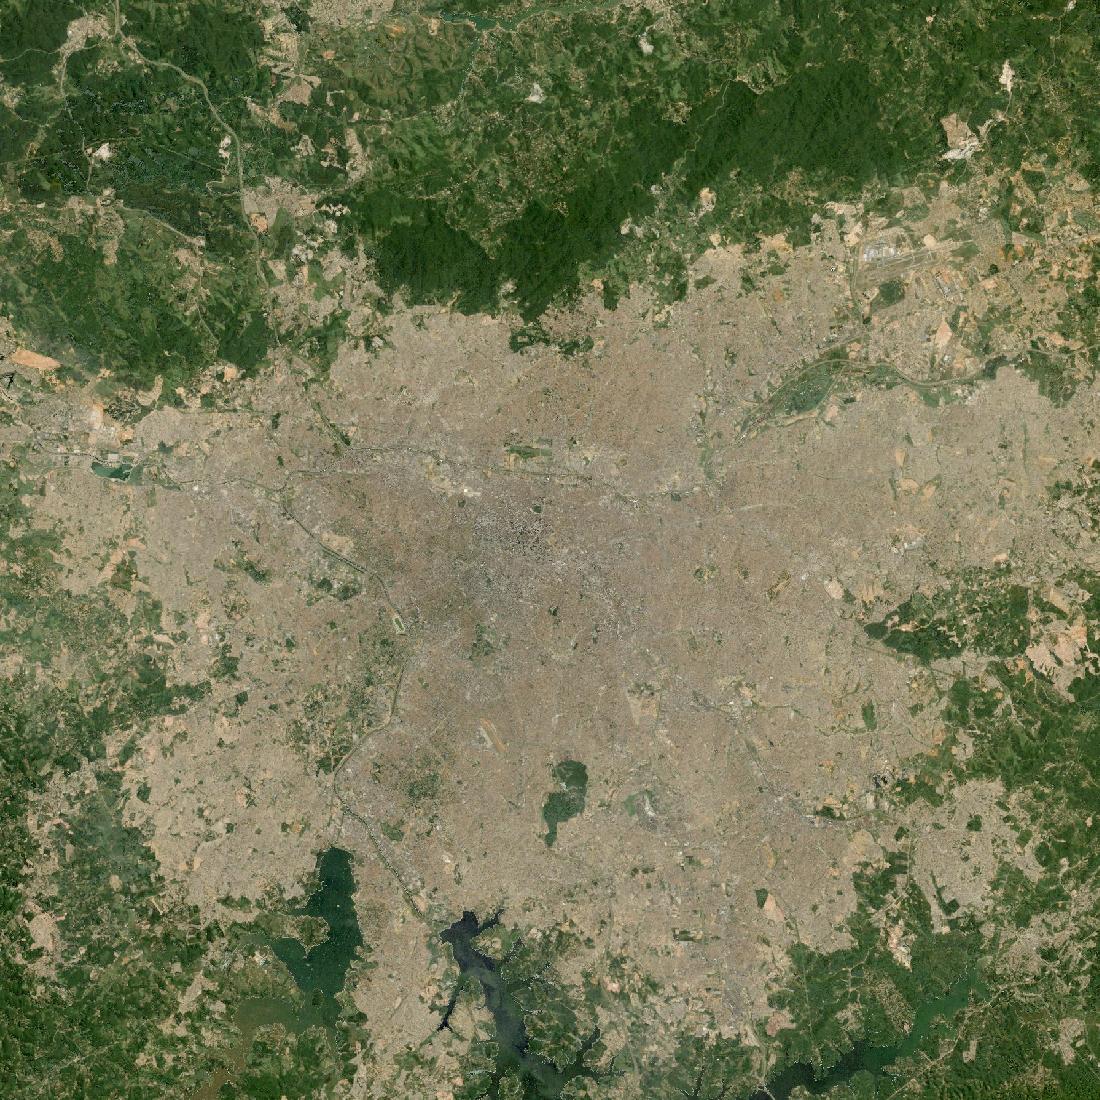 199050 km50 km
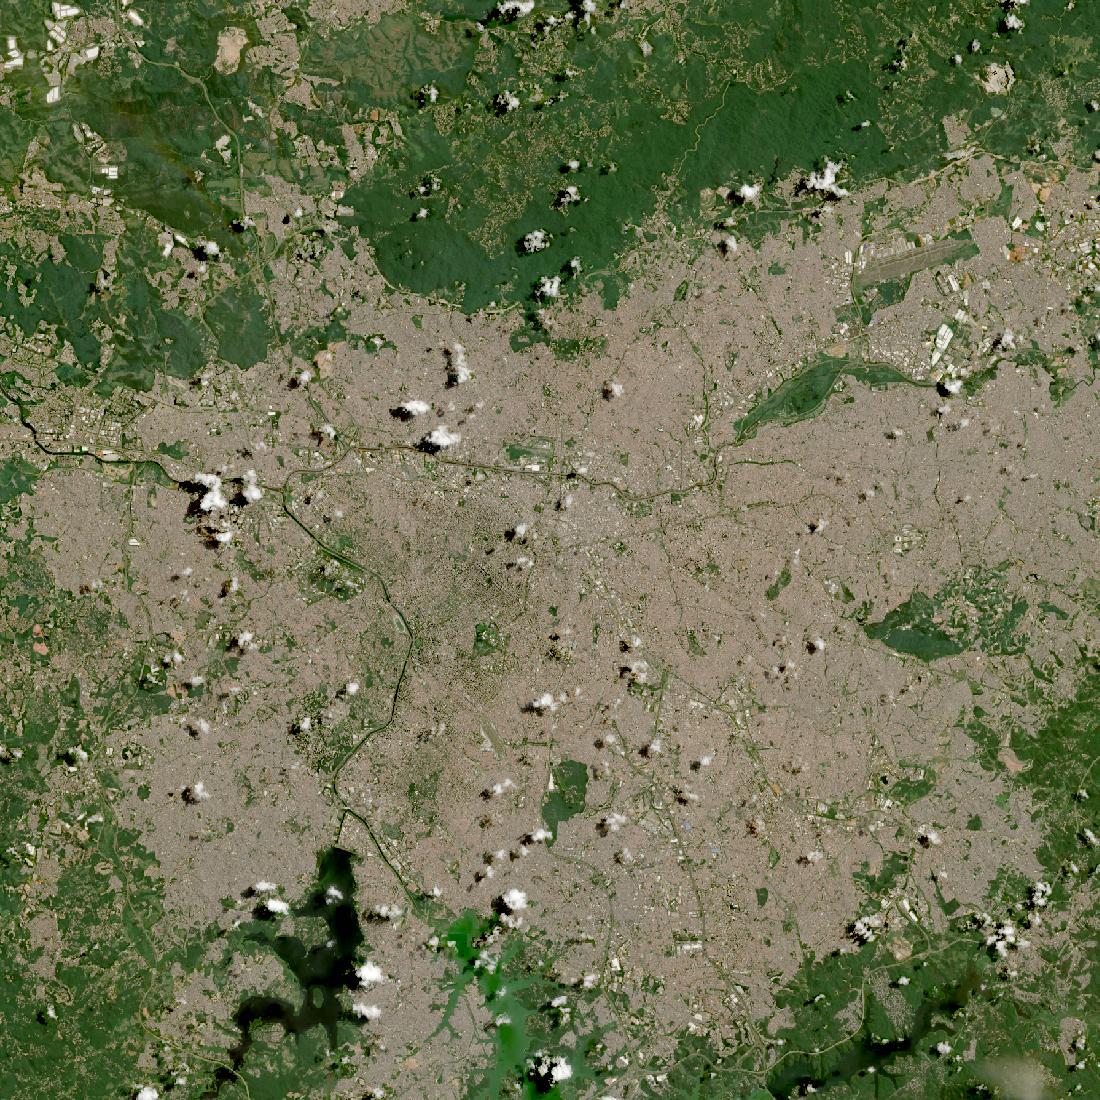 2025-02-2450 km50 km
- Built-up area
- 470 → 589 km²
- 1.3×
- People in frame
- 14.7M → 18.0M
- 1.2×
- People per km²
- 5,867 → 7,195
- Per square mile
- 15,200 → 18,639
Already vast in the older frame and slower since. Only Tokyo and New York had larger footprints in 1990.
Paris
barely changed
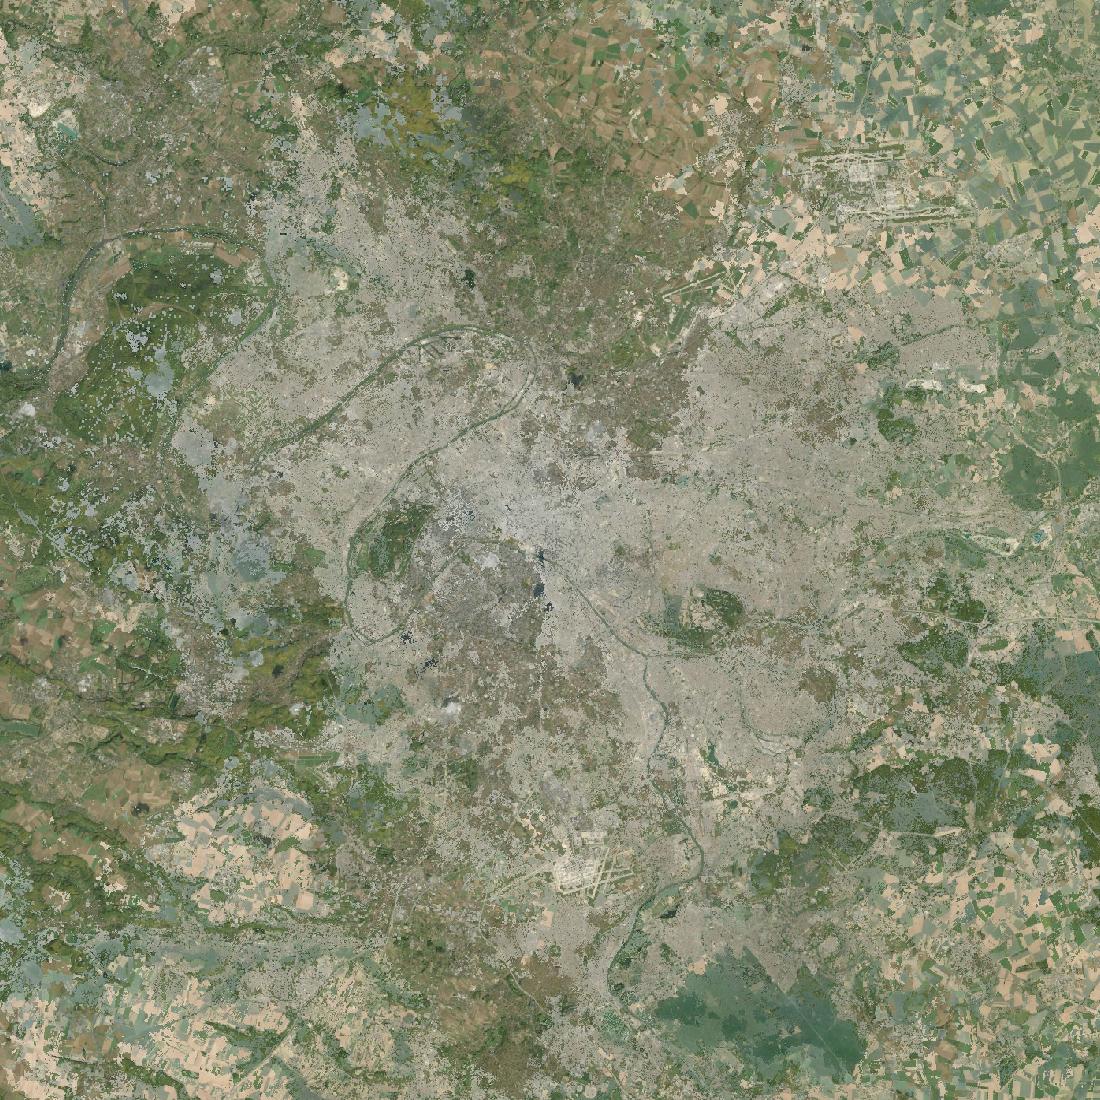 198650 km50 km
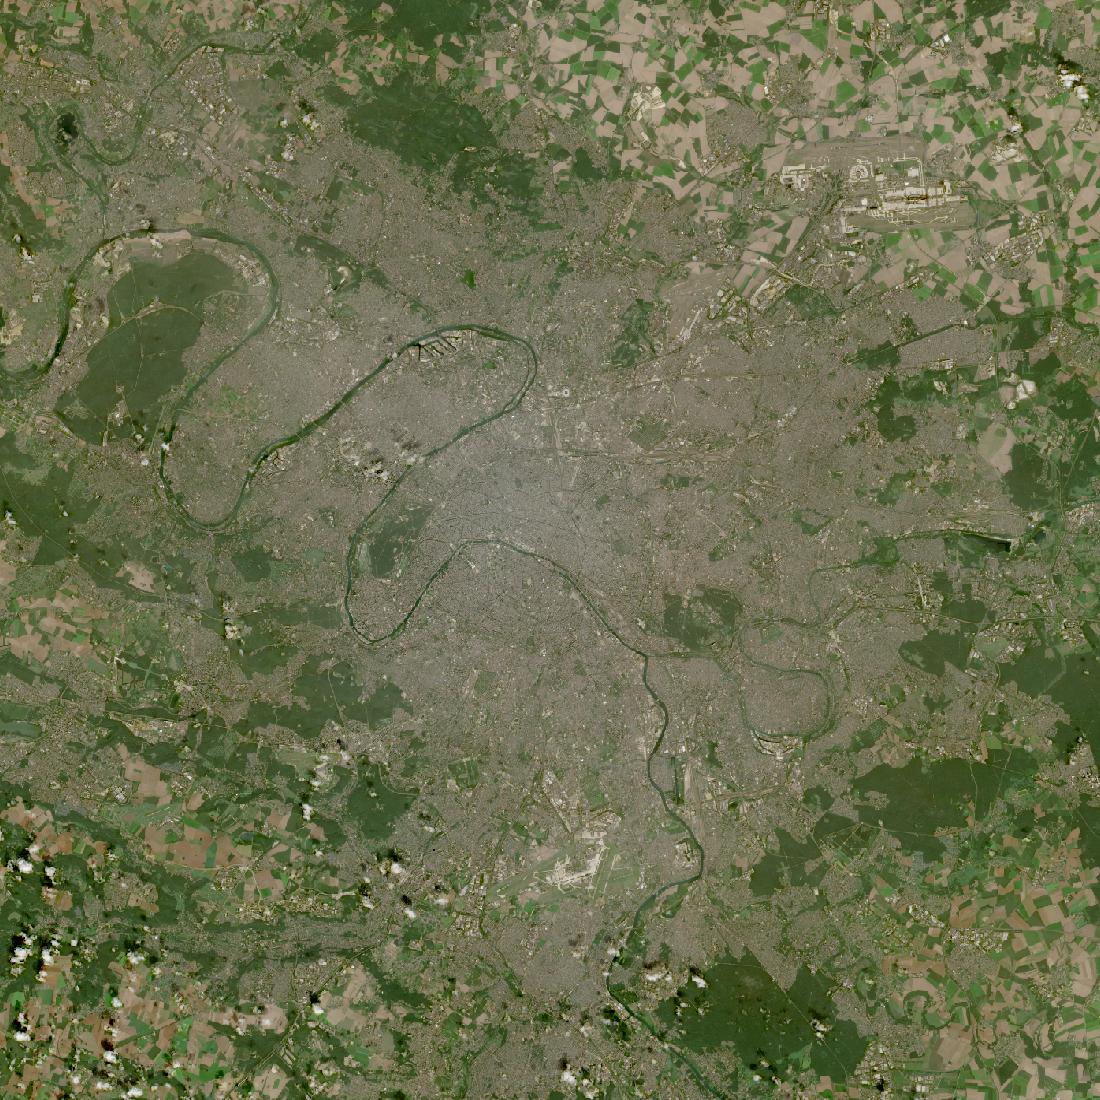 2024-09-0150 km50 km
- Built-up area
- 361 → 427 km²
- 1.2×
- People in frame
- 8.7M → 10.0M
- 1.1×
- People per km²
- 3,488 → 3,994
- Per square mile
- 9,036 → 10,347
Held its shape for four decades: a fifth more ground, a tenth more people. Among the flattest cities here on both measures.
Tokyo
barely changed
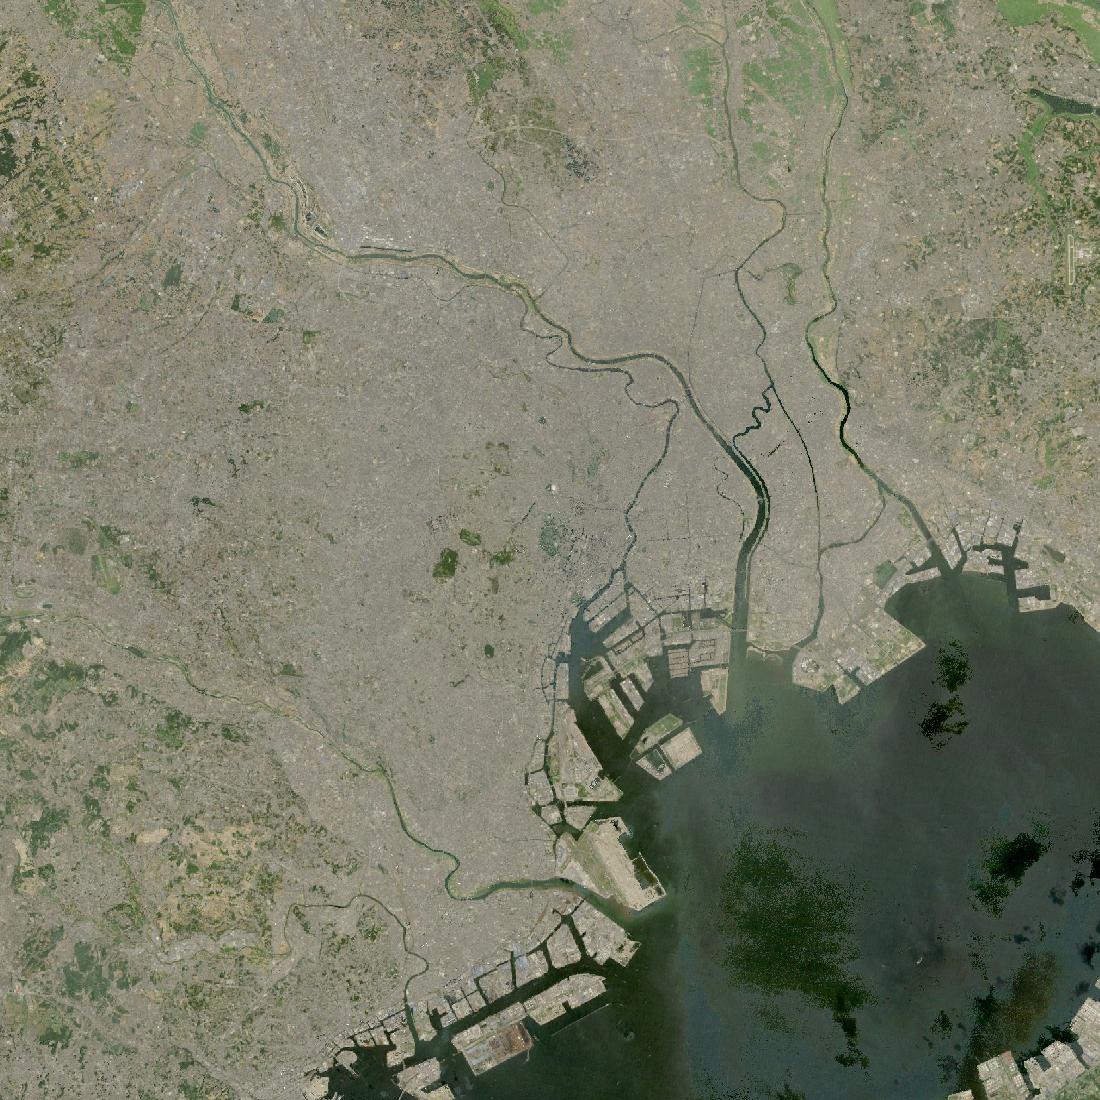 199050 km50 km
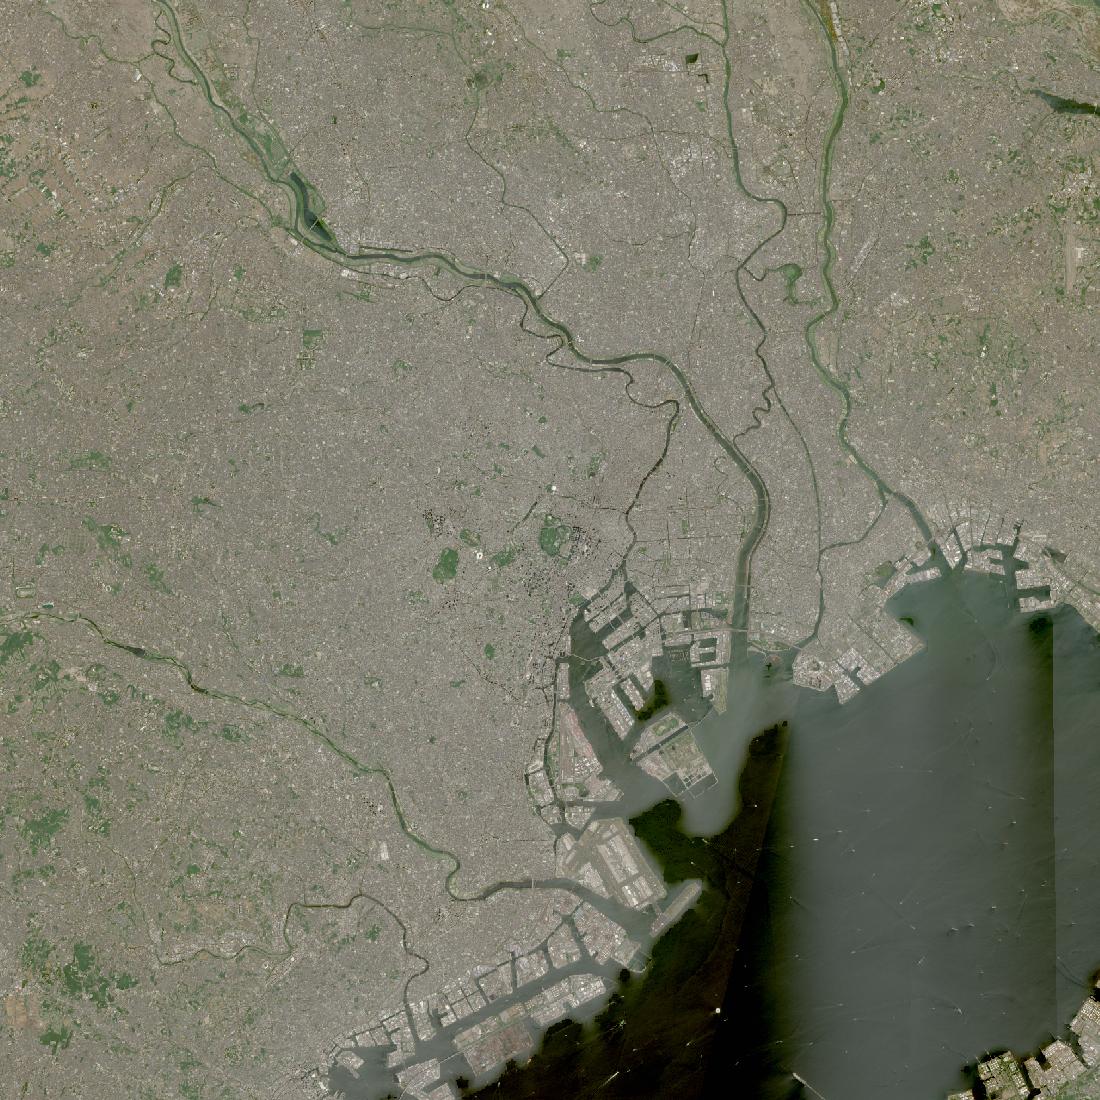 2025-04-2150 km50 km
- Built-up area
- 589 → 678 km²
- 1.1×
- People in frame
- 17.5M → 20.2M
- 1.2×
- People per km²
- 6,987 → 8,091
- Per square mile
- 18,102 → 20,960
Builds constantly and expands not at all. Its footprint was already the largest here in 1990 and has grown a tenth since, while Japan's population peaked in 2008. Tokyo's construction replaces buildings rather than adding to the edges, a distinction satellites cannot see but building permits can.
London
built up more than out
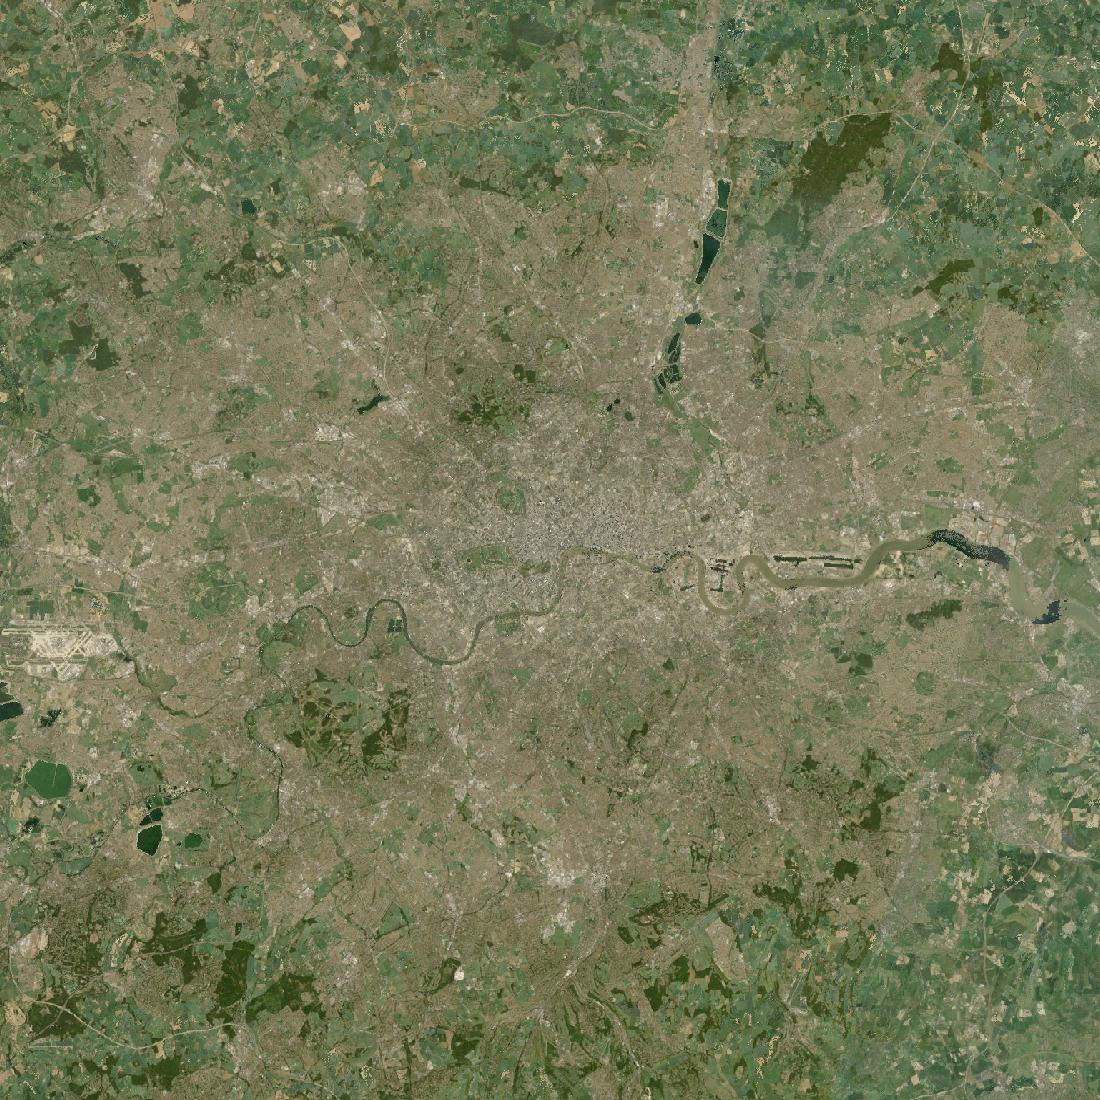 199050 km50 km
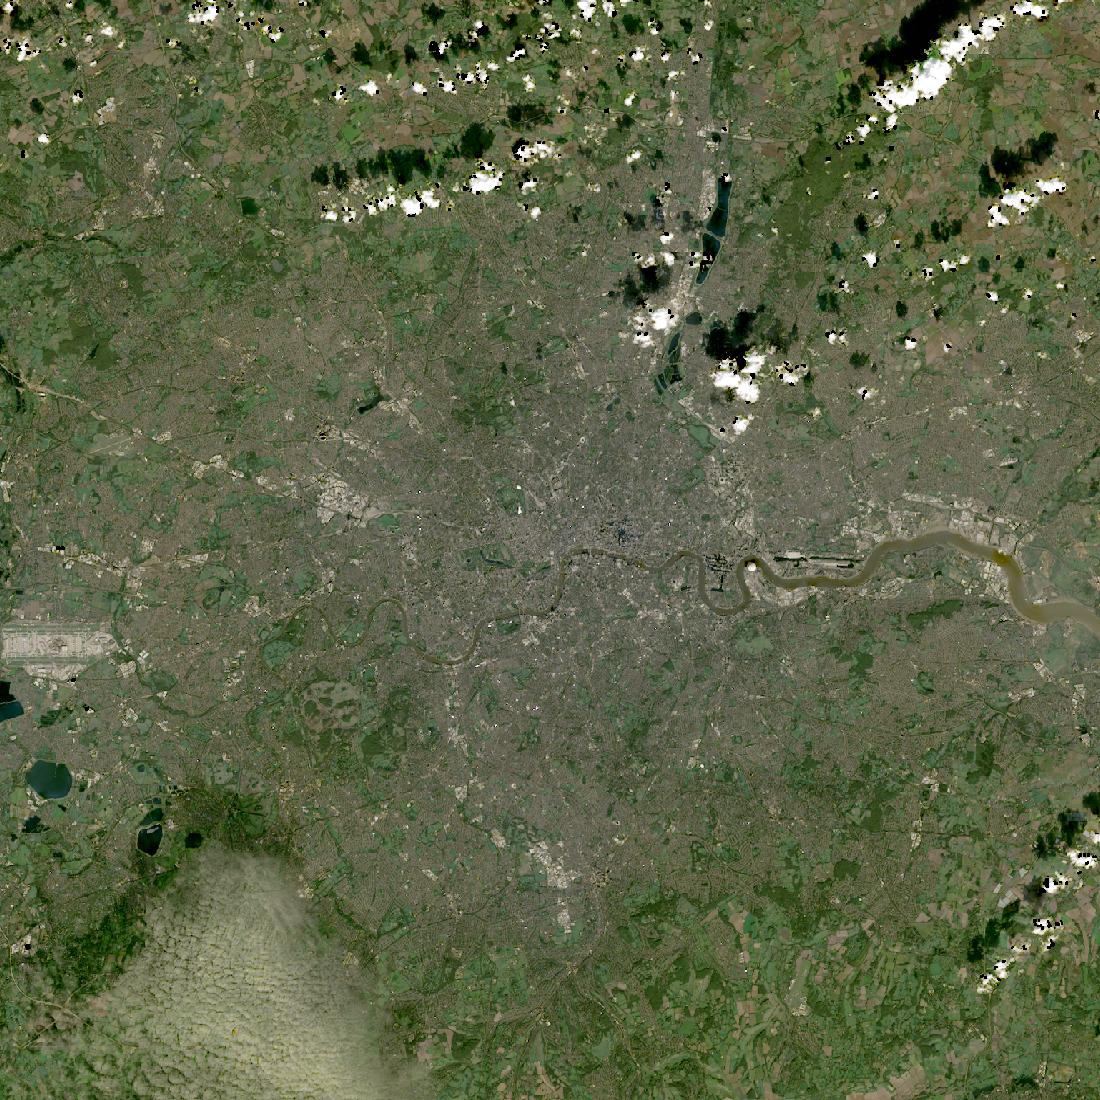 2024-10-1150 km50 km
- Built-up area
- 375 → 423 km²
- 1.1×
- People in frame
- 7.6M → 10.8M
- 1.4×
- People per km²
- 3,020 → 4,319
- Per square mile
- 7,825 → 11,190
A tenth more ground and 40 per cent more people, so the average Londoner lives more densely than in 1990. The green belt is visible from orbit as the line where building stops.
New York
barely changed
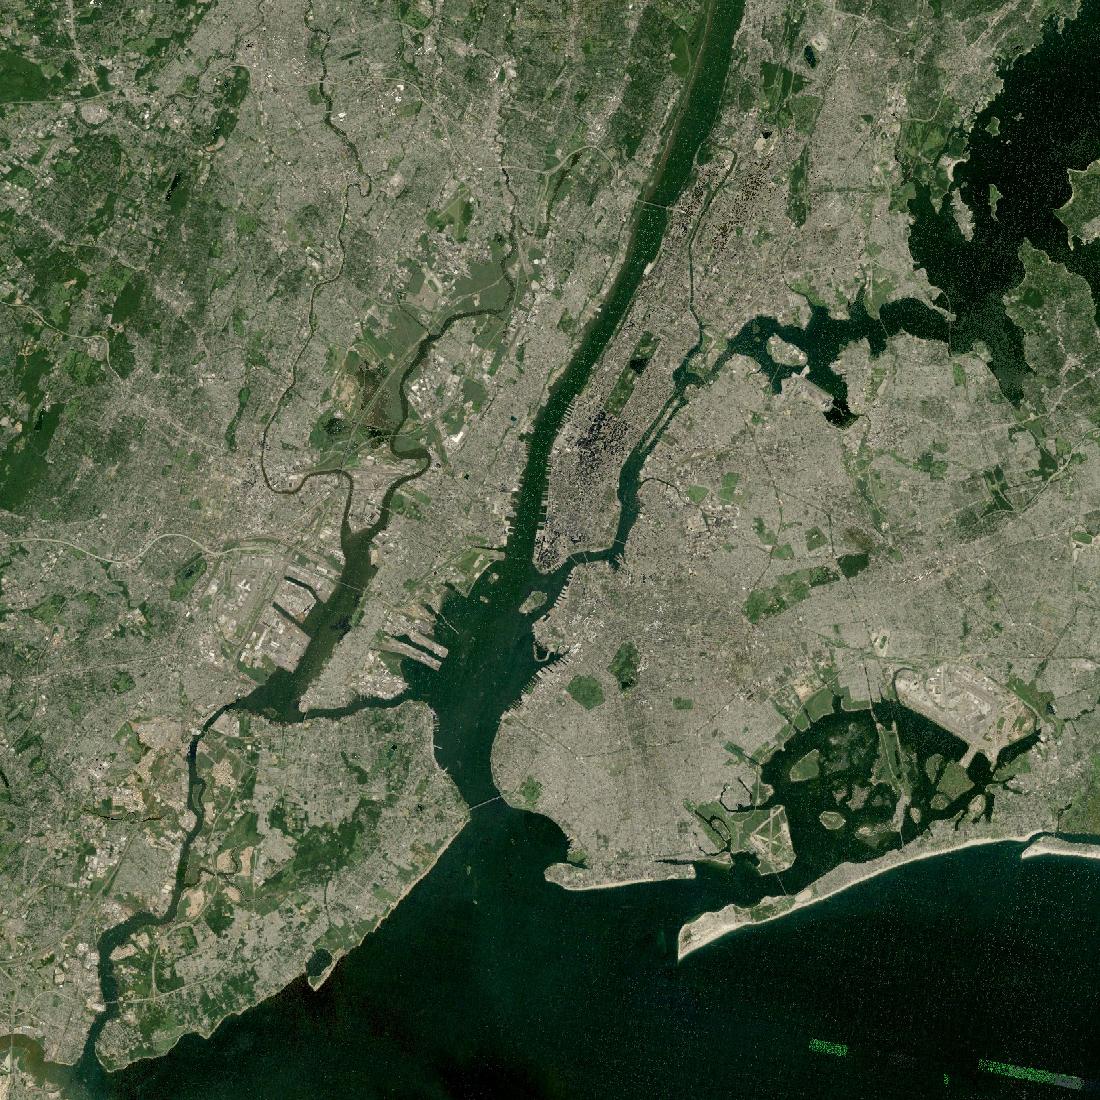 199050 km50 km
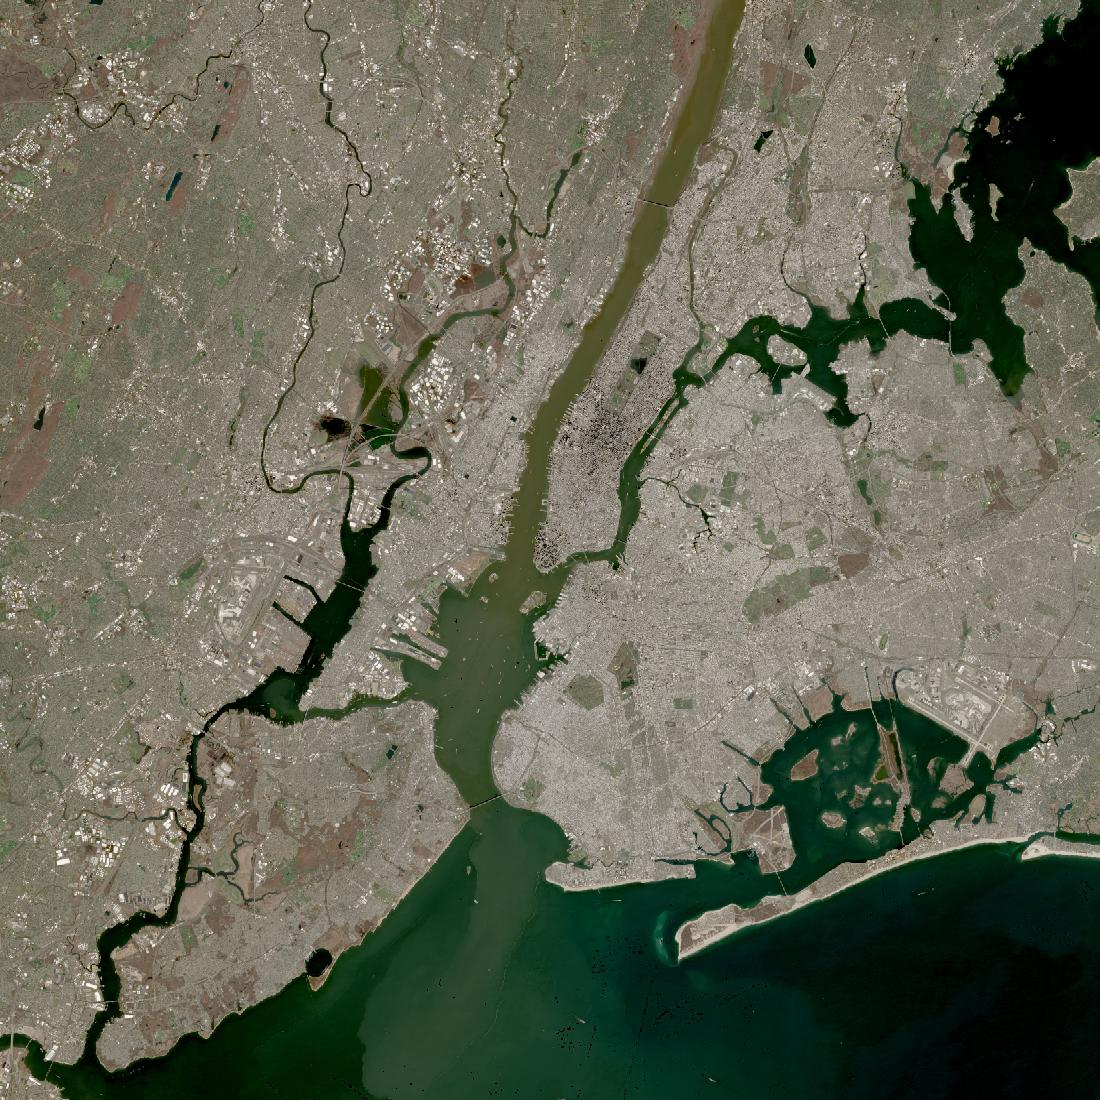 2026-04-0850 km50 km
- Built-up area
- 402 → 439 km²
- 1.1×
- People in frame
- 10.1M → 11.7M
- 1.2×
- People per km²
- 4,032 → 4,686
- Per square mile
- 10,446 → 12,141
Already among the largest footprints here in 1990, behind only Tokyo and Sao Paulo, and barely moved since. What growth there was went upward and into the existing fabric rather than outward.
Twenty cities, two measures
Sorted by built-up area · both figures describe the square shown
How much more land each city has built on, and how many more people live there. The distance between the two columns separates cities that built for arrivals from cities that built over people already in place.
| City | 1990 km² | 2025 km² | Built-up | People | Per km² | Pattern | |
|---|---|---|---|---|---|---|---|
| Chengdu | 65 | 301 | 4.6× | 1.2× | 2,703 | absorbed its hinterland |
| Chongqing | 56 | 209 | 3.7× | 3.0× | 3,985 | grew in step |
| Shenzhen | 90 | 317 | 3.5× | 4.4× | 5,954 | built up more than out |
| Ho Chi Minh City | 122 | 385 | 3.1× | 3.2× | 5,787 | grew in step |
| Chennai | 84 | 222 | 2.7× | 1.6× | 4,421 | absorbed its hinterland |
| Shanghai | 216 | 545 | 2.5× | 3.3× | 10,581 | built up more than out |
| Dubai | 90 | 209 | 2.3× | 5.7× | 1,777 | built on empty land |
| Bangkok | 252 | 559 | 2.2× | 2.5× | 6,927 | grew in step |
| Beijing | 273 | 562 | 2.1× | 2.3× | 7,099 | grew in step |
| Cairo | 191 | 391 | 2.0× | 2.1× | 9,812 | grew in step |
| Riyadh | 221 | 421 | 1.9× | 3.4× | 3,562 | built on empty land |
| Tel Aviv | 88 | 153 | 1.7× | 2.6× | 1,706 | built on empty land |
| Delhi | 313 | 494 | 1.6× | 2.5× | 11,985 | built on empty land |
| Houston | 276 | 430 | 1.6× | 2.0× | 1,648 | built up more than out |
| Sao Paulo | 470 | 589 | 1.3× | 1.2× | 7,195 | grew in step |
| Paris | 361 | 427 | 1.2× | 1.1× | 3,994 | barely changed |
| Tokyo | 589 | 678 | 1.1× | 1.2× | 8,091 | barely changed |
| San Francisco | 156 | 175 | 1.1× | 1.1× | 927 | barely changed |
| London | 375 | 423 | 1.1× | 1.4× | 4,319 | built up more than out |
| New York | 402 | 439 | 1.1× | 1.2× | 4,686 | barely changed |
Sources & Methodology
How these pictures and these numbers were made
Each city is a fixed 50 km square centred on its downtown, identical in both years. The recent frame is chosen by sweeping candidate dates across a two-year window, scoring every returned frame for cloud and swath gap from pixel statistics, and keeping the clearest. The early frame is the earliest year the WELD annual archive covers cleanly, 1990 where available. Ground covered and population are summed from the GHSL grids over the same bounding box, never derived from the photographs.
Every frame is the same 50 km square — 2,500 km², or 965 square miles — so people per square kilometre is population divided by a constant. It is the one figure here that needs no judgement about what counts as built-up: two inputs, and one of them is a number we chose rather than measured.
Imagery: NASA Worldview Snapshots (GIBS): Landsat WELD annual true colour for the early frame, HLS S30/L30 true colour for the recent one — courtesy NASA, free to reuse with attribution. Measures: EC JRC Global Human Settlement Layer R2023A, GHS-POP and GHS-BUILT-S, 30 arc-second grids, 1990 and 2025 epochs.
- A frame is a square, not an administrative city: Shenzhen's takes in part of Hong Kong and Houston's reaches past the city line, so these figures differ from any official city population.
- People per square kilometre is population divided by the frame's fixed 2,500 km2, so it describes the whole square - water, desert and open country included. Dubai's frame is half sea and San Francisco's is a third water, which is why their figures sit low. It is a like-for-like comparison between these frames, not any city's official density.
- GHS-BUILT-S measures built surface footprint, not height or floor area, so a city that grew upward reads as flat here.
- The two photographs come from different instruments at different resolutions; nothing is measured from the pixels, and the 50 km span is wide enough that the resolution difference does not drive the comparison.
- Recent frames span September 2024 to April 2026 because clear skies do not arrive on schedule; each panel carries its own date.
- Paris's early frame is 1986, the earliest year the WELD archive covers it without a swath gap.