
Research
Try “office”, “Nvidia”, “remote work”, “inequality”.



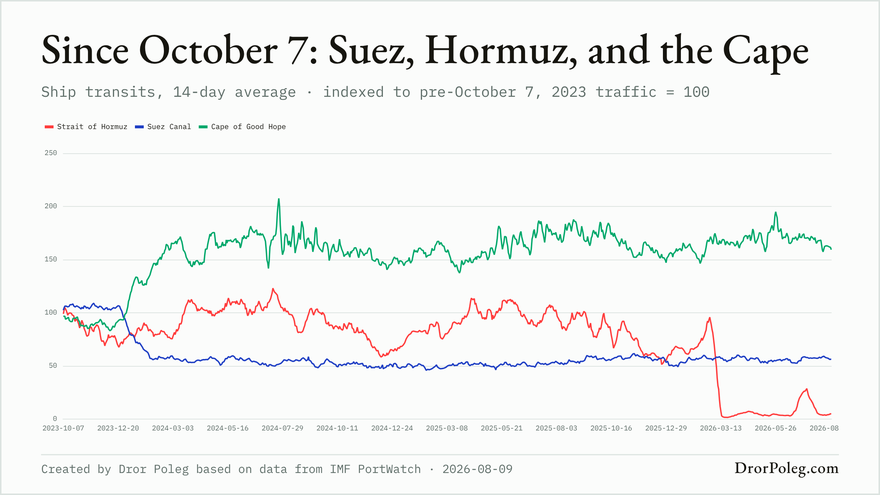
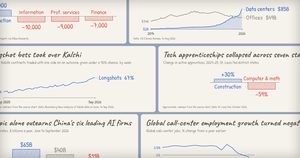
OpenAI and Anthropic need up to $2.79 trillion a year to earn their prices
A University of Poitiers researcher ran reverse cash-flow calculations on OpenAI's and Anthropic's 2026 funding-round valuations and mapped public deals that go beyond selling model access.
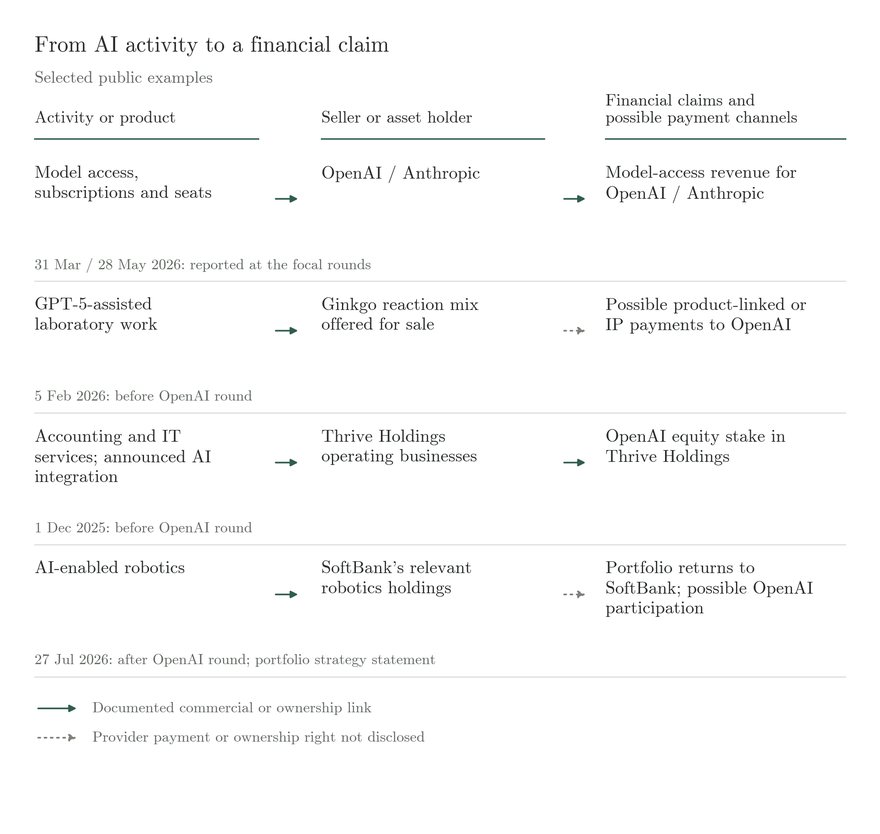
“Treating the announced financing prices as hypothetical operating-value targets, reverse cash-flow calculations for OpenAI and Anthropic yield combined year-ten revenue requirements of $2.79 trillion or $733 billion, depending on financial assumptions.”
Is the business of frontier AI companies selling tokens? Value capture and equity prices →
Andrew J. Peterson
Anthropic went from 2,500 to 30,000 merged code changes a day
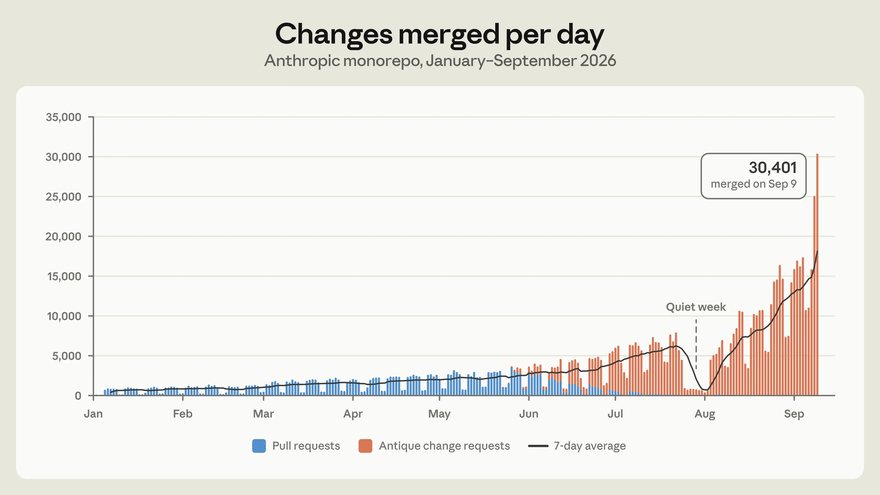
“The bottleneck, now, is all of the developer infrastructure built for human scale: source control, builds, and CI. In May 2026, Anthropic averaged around 2,500 code changes merged per day; as of September, we merged over 30,000 per day.”
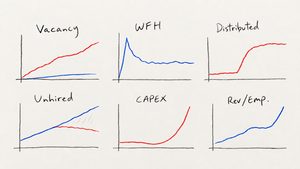
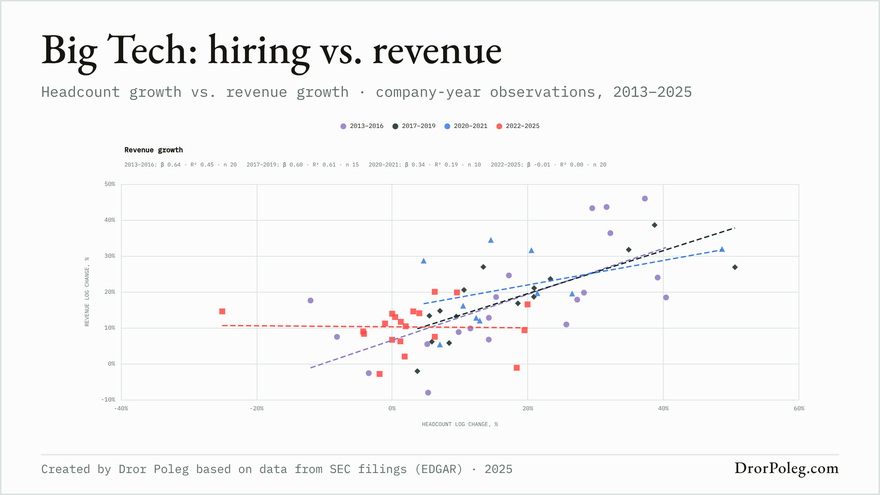
The post-2019 productivity boom is landing in profit margins
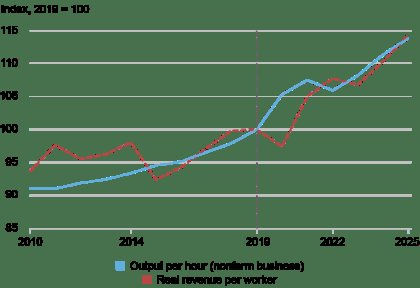
“I first show that the acceleration appears in public firms’ revenue per worker, then document how the gains went into profit margins, and finally, what firm characteristics predicted significant profit margin increases.”
Revenue per Worker Is Up. Are Firms Getting a Larger Share? →
Jeremy Pearce
Holiday hiring is moving from the store to the warehouse
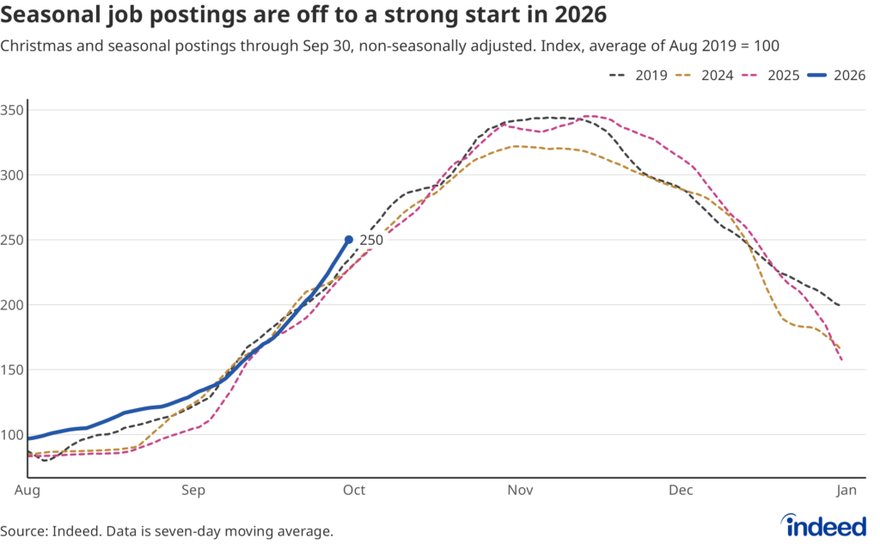
“In 2019, retail accounted for about two-thirds of all seasonal jobs, compared to a little over 61% this year. Much of that share has moved into loading and stocking roles, the warehouse work that sits behind every online order.”
Seasonal Hiring Is Off to a Fast Start, With an Eye Toward 2027 →
Cory Stahle
Americans have retreated from church, clubs and dinner tables since 1995
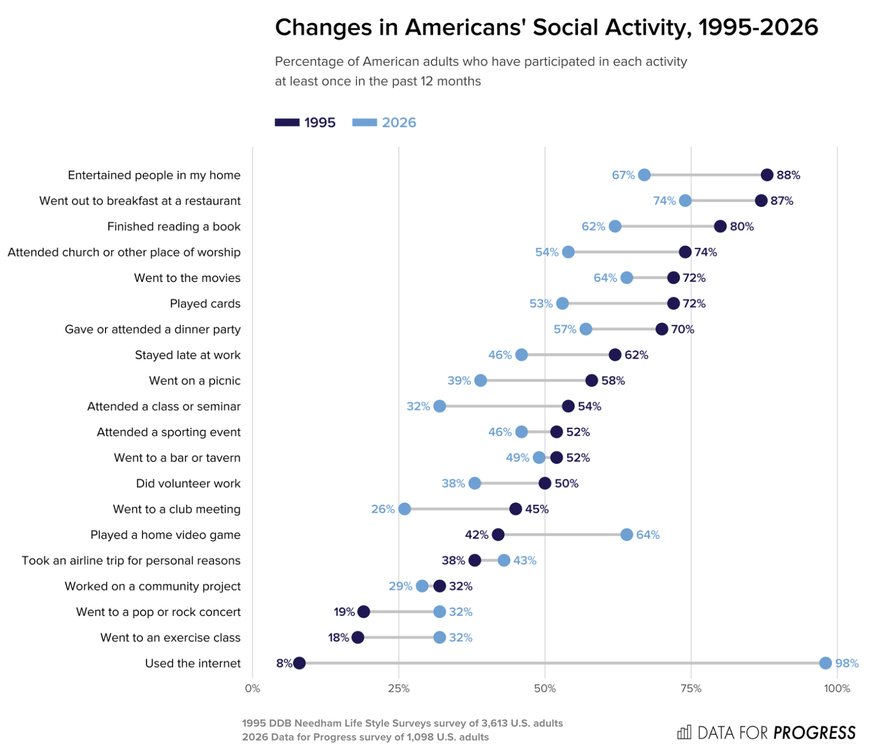
“This new analysis demonstrates that Americans are indeed spending less time in specific social settings, such as restaurants, churches, picnics, parties, bars, and social clubs.”
Americans’ Social Activity Has Steeply Declined in the Past 30 Years →
Lew Blank
 Dror Poleg@drorpoleg · Oct 13, 2026
Asymmetry on steroids: "Russia had more than 50,000 casualties in Ukraine last month, with as many as 28,000 personnel killed... Ukrainian forces suffered about 5,000 casualties in the same period"

2020· Jul 17
“Have you been following the evolution of AI and GPT-3?... So many things will change over the next few years!”
2023· Mar 27
“Tech skills will continue to be in high demand. But tech jobs will become less safe... When everyone can build software, many average or less creative programmers will suddenly face intense competition.”
2019
“Technological innovation might lead to dramatic growth in economic activity and corporate profits while simultaneously reducing overall demand for office space.”
2020· Mar 3
“America is in complete denial about #Covid_19... expect more bad news to come once we catch up to reality.”
2020· Jul 3
“Buildings in many traditional employment districts will have to compete more fiercely and many of them will ultimately have to be repurposed.”
2023· May 26
“Can [Nvidia] be worth five trillion in five years? I think it has a decent shot.”